简介
zabbix 是一个企业级的分布式开源监控方案,能够监控各种网络参数以及服务器健康性和完整性的软件,支持自定义配置和自定义告警,并且可以实现邮件、短信等方式的告警,
zabbix基本组件如下:
- zabbix_server: zabbix服务端守护进程,所有的监控数据都会统一汇总给server。
- zabbix_agentd: 客户端守护进程,负责执行server命令,收集客户端各种参数,如cpu负载,内存,硬盘io等。
- zabbix_get: zabbix的一个工具,通常用于从server或者proxy获取远程客户端的信息,以及故障排查等。
- zabbix_sender: zabbix的一个工具,用于发送数据给server或者proxy,通常用于耗时比较长的检查。
- zabbix_proxy: zabbix代理守护进程,功能类似server,作为中转站将收集到的数据转发给server,主要就是用于分布式集群中分担server的负担,构成类似分布式的server架构,但是最终数据还是要提交给server来汇总。
安装
官方安装
https://www.zabbix.com/documentation/3.4/zh/manual/installation/install_from_packages
这里使用源码安装
下载源代码
https://www.zabbix.com/download_sources1
2tar xf zabbix-3.4.9.tar.gz
cd zabbix-3.4.9
创建用户账户
1 | groupadd zabbix |
注:如果Zabbix server 和 agent 运行在同一台计算机上,建议使用不同的账户运行Server和Agent
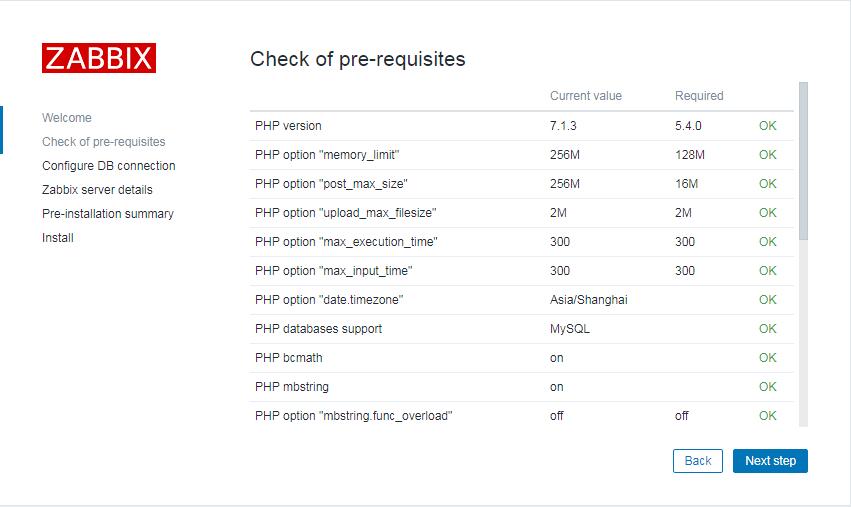
要求
php版本 >=5.4.0
php.ini1
2
3
4
5
6
7
8
9memory_limit = 128M
post_max_size = 16M
upload_max_filesize = 2M
max_execution_time = 300
max_input_time = 300
session.auto_start = 0
mbstring.func_overload = 0
always_populate_raw_post_data = -1
date.timezone = "Asia/Shanghai"
编译
1 | apt-get install libsnmp-dev libevent-dev libpcre3-dev libcurl4-openssl-dev -y |
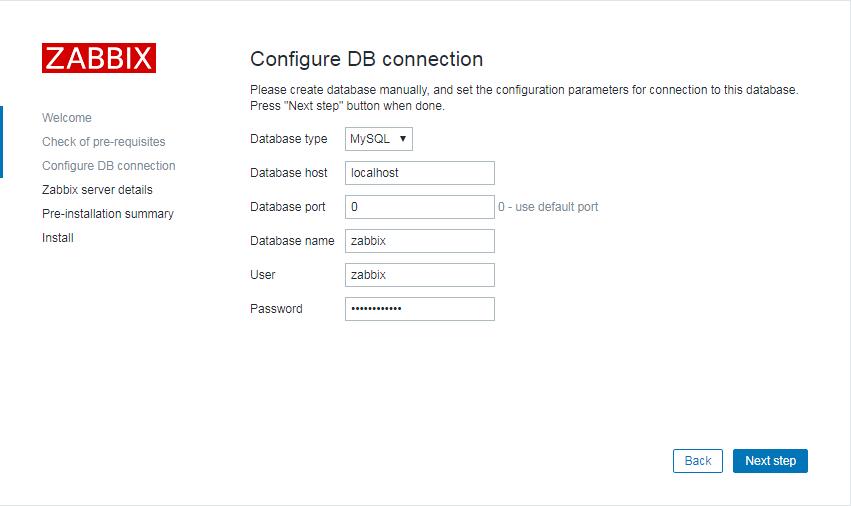
创建zabbix数据库
1 | 授权 |
导入schema.sql会很久很久,请耐心等候,images.sql,data.sql则很快
启动设置
1 | ln -sv /usr/local/zabbix/etc /etc/zabbix |
配置文件
#配置zabbix_server文件1
2
3
4
5
6
7
8
9
10
11vim /etc/zabbix/zabbix_server.conf
DBHost=localhost #数据库所在主机
DBName=zabbix #数据库名
DBUser=zabbix #数据库用户
DBPassword=123456 #数据库密码
#配置zabbix_agent
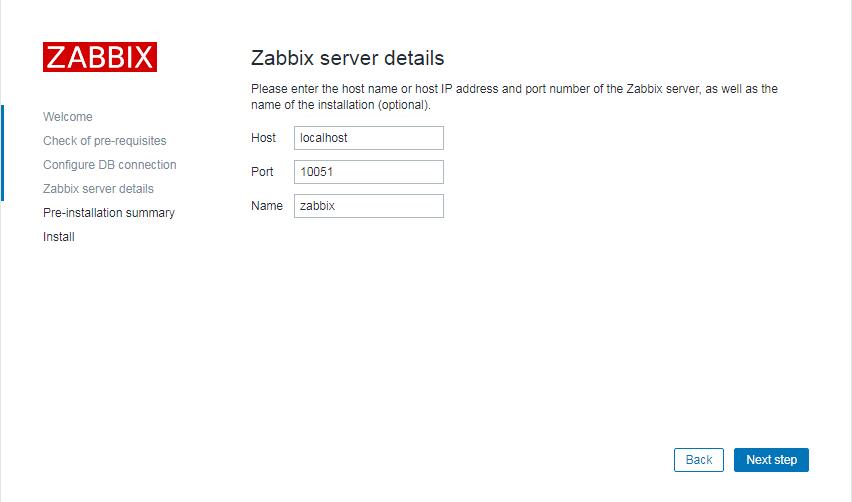
vim /etc/zabbix/zabbix_server.conf
Server=127.0.0.1 修改Server端的IP地址(被动模式IP地址)
ServerActive=127.0.0.1 主动模式,主动向server端报告
#注:这里本机才指定127.0.0.1,其他客户端需要指定内网IP
启动服务
1 | /etc/init.d/zabbix_agent start |
前端配置
1 | cp frontends/php /www/web/zabbix -r |


Zabbix前端已经就绪!默认的用户名是Admin,密码是zabbix.
WEB界面
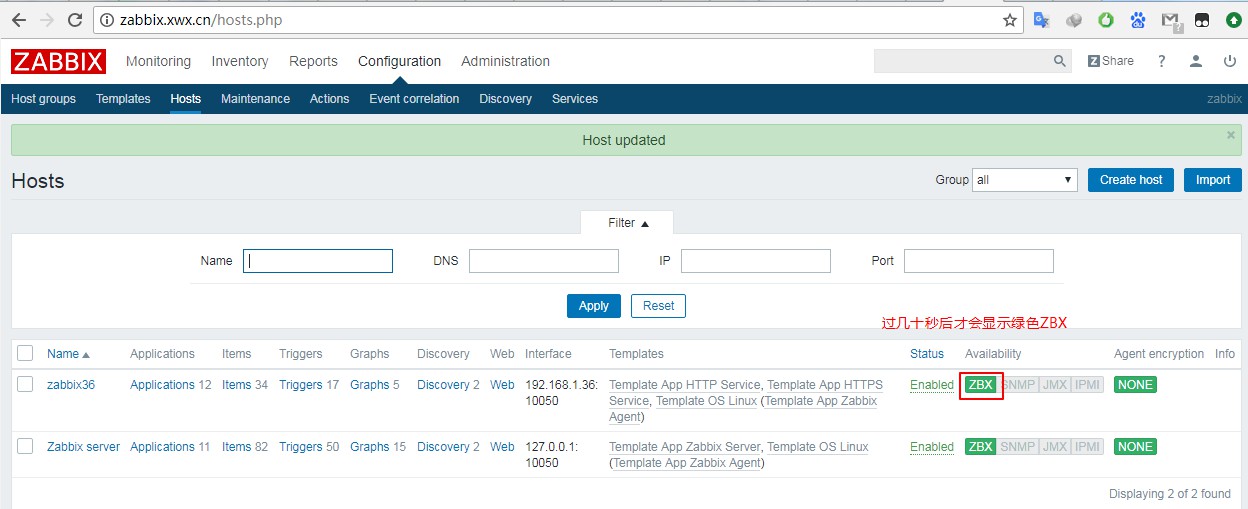
激活客户端
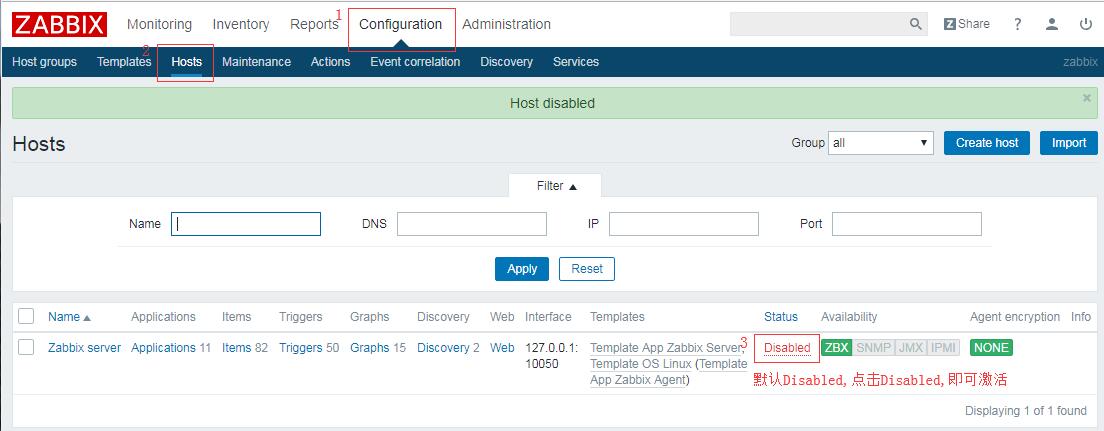
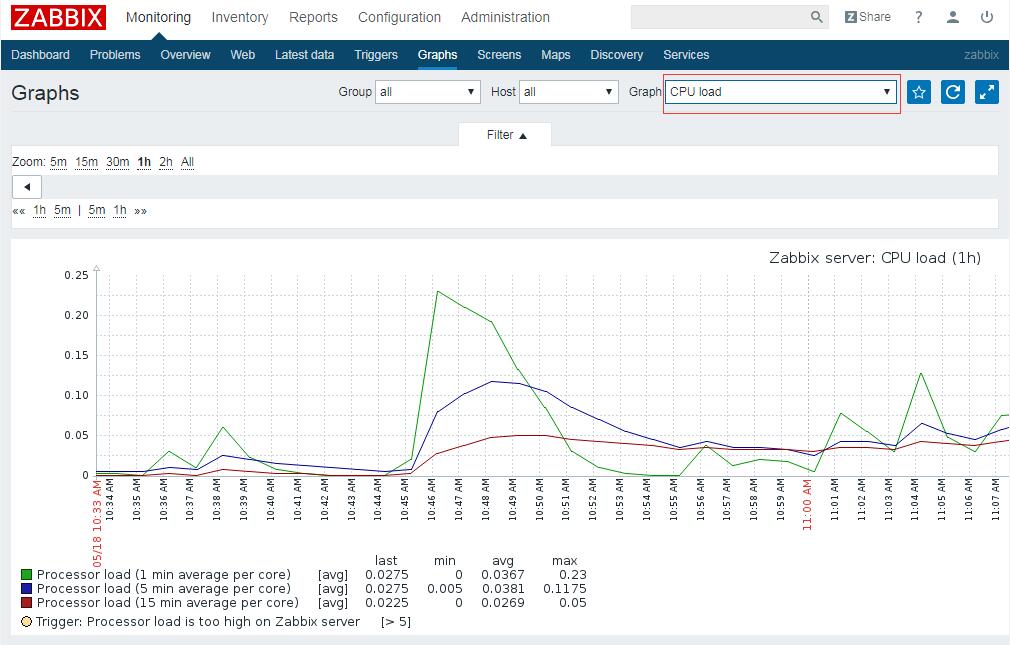
查看cpu负载
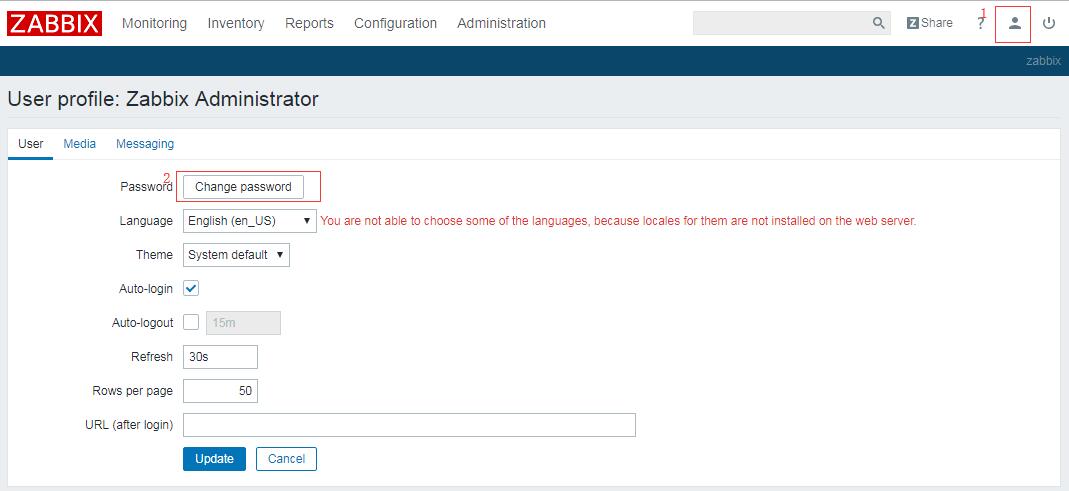
修改密码
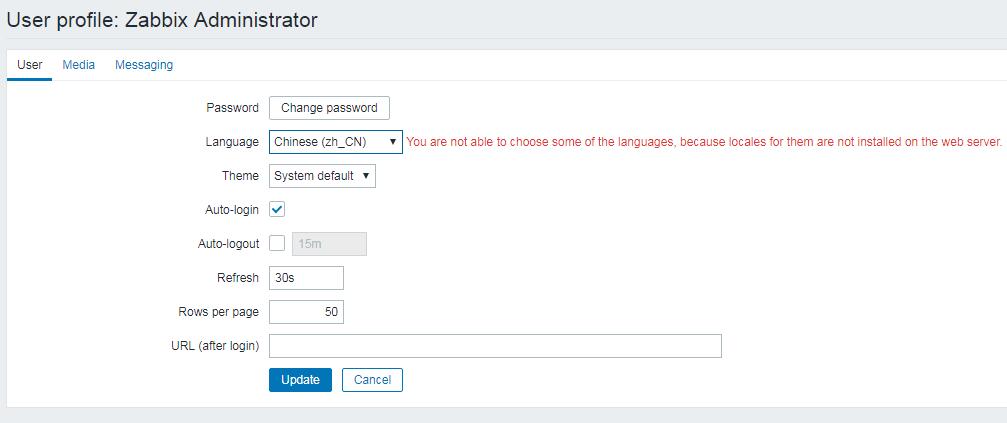
设置中文
1 | 上传微软雅黑( msyh.ttf |
监控部署
https://www.zabbix.com/download?zabbix=3.4&os_distribution=ubuntu&os_version=xenial&db=MySQL
安装客户端 web36
1 | wget http://repo.zabbix.com/zabbix/3.4/ubuntu/pool/main/z/zabbix-release/zabbix-release_3.4-1+xenial_all.deb |
添加监控主机及设置
自定义监控 Nginx Status
客户端web36 添加ginx_status.conf配置文件
cat /etc/nginx/vhost/nginx_status.conf
1 | server { |
查看nginx_status状态
1 | Active connections: 7 |
添加Include
vim /etc/zabbix/zabbix_agentd.conf
vim /etc/zabbix/zabbix_agentd.conf.d/scripts/nginx_status.sh1
2
3
4
5
6
7
8
9
10
11
12
13
14
15
16
17
18
19
20
21
22
23
24
25
26
27
28
29
30
31
32
33
34
35
36
37
38
#auther: sunday
#Date: 2018-05-27
HOST="localhost"
PORT="80"
STATUS="nginx_status"
[ $# -ne 1 ] && echo "$0 Usage:(active|reading|writing|waiting|accpets|handled|requests)" && exit 0
#检测nginx进程是否存在
function ping {
/sbin/pidof nginx | wc -l
}
# 检测nginx性能
function active {
/usr/bin/curl "http://$HOST:$PORT/$STATUS/" 2>/dev/null| grep 'Active' | awk '{print $NF}'
}
function reading {
/usr/bin/curl "http://$HOST:$PORT/$STATUS/" 2>/dev/null| grep 'Reading'| awk '{print $2}'
}
function writing {
/usr/bin/curl "http://$HOST:$PORT/$STATUS/" 2>/dev/null| grep 'Writing'| awk '{print $4}'
}
function waiting {
/usr/bin/curl "http://$HOST:$PORT/$STATUS/" 2>/dev/null| grep 'Waiting'| awk '{print $6}'
}
function accepts {
/usr/bin/curl "http://$HOST:$PORT/$STATUS/" 2>/dev/null| awk NR==3 | awk '{print $1}'
}
function handled {
/usr/bin/curl "http://$HOST:$PORT/$STATUS/" 2>/dev/null| awk NR==3 | awk '{print $2}'
}
function requests {
/usr/bin/curl "http://$HOST:$PORT/$STATUS/" 2>/dev/null| awk NR==3 | awk '{print $3}'
}
#执行function
$1
chmod +x /etc/zabbix/zabbix_agentd.conf.d/scripts/nginx_status.sh
cat /etc/zabbix/zabbix_agent.conf.d/nginx_status.conf
修改完配置文件需要重启zabbix-agent1
/etc/init.d/zabbix-agent restart
服务端操作
zabbix-get测试 是否可以获取到agent上的值1
2 zabbix_get -s 192.168.1.36 -k 'nginx.status[requests]'
12053819
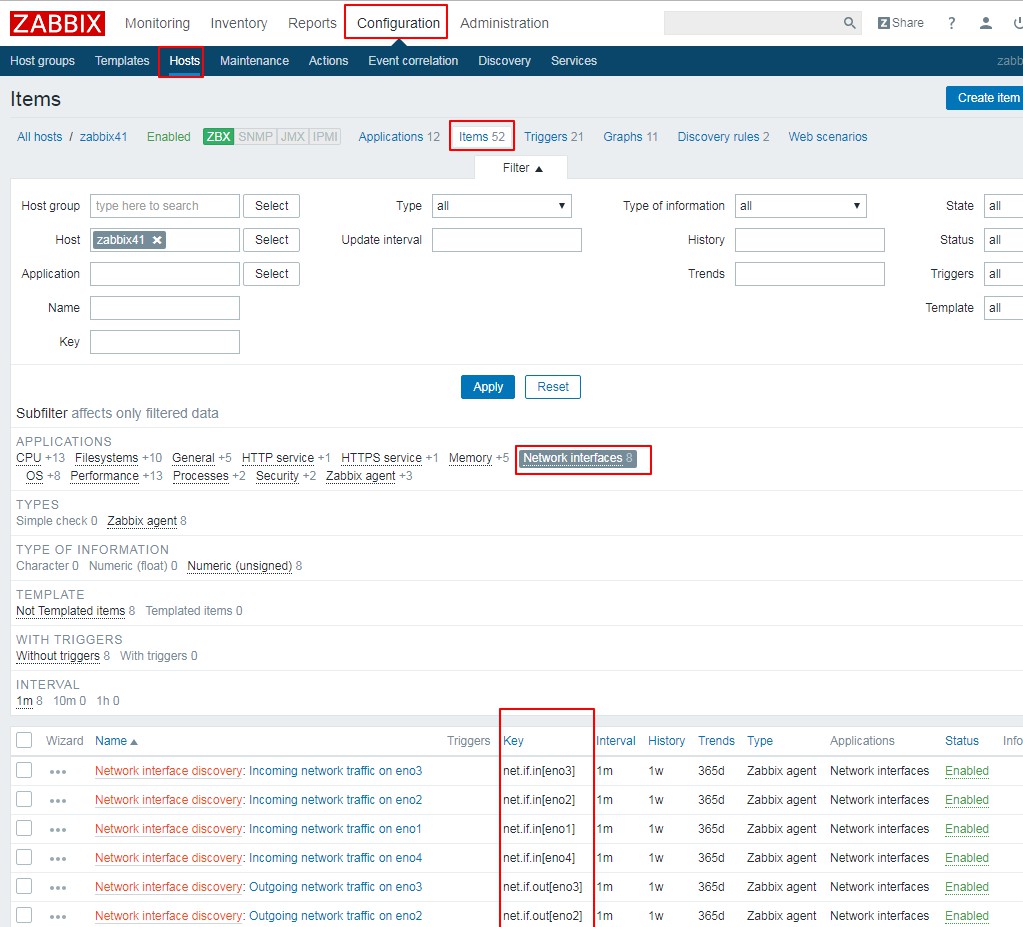
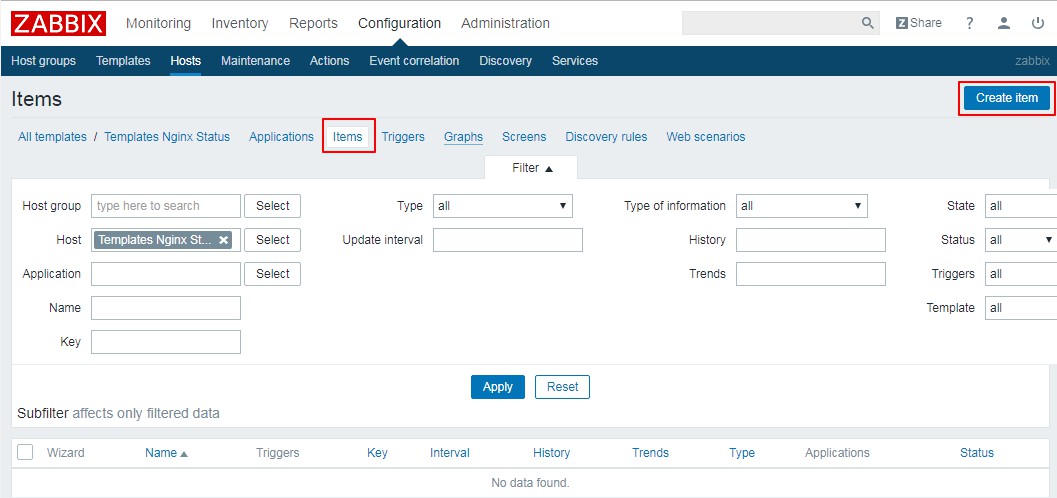
创建项目 Item
Configuration > hosts > Item > Create item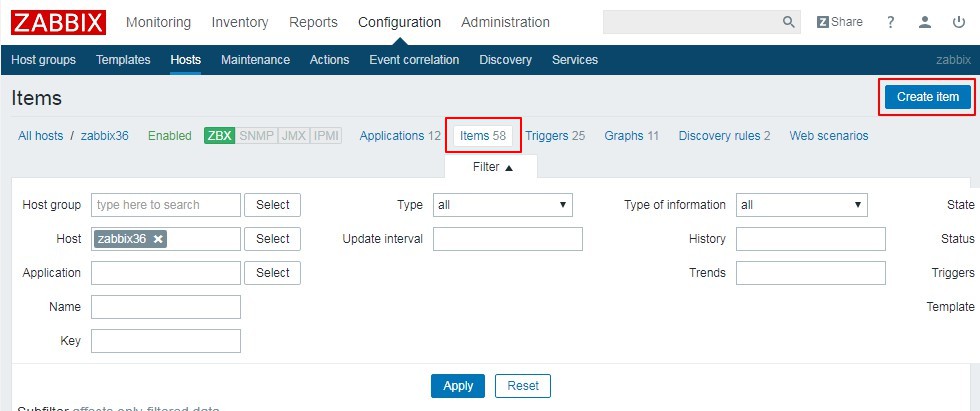
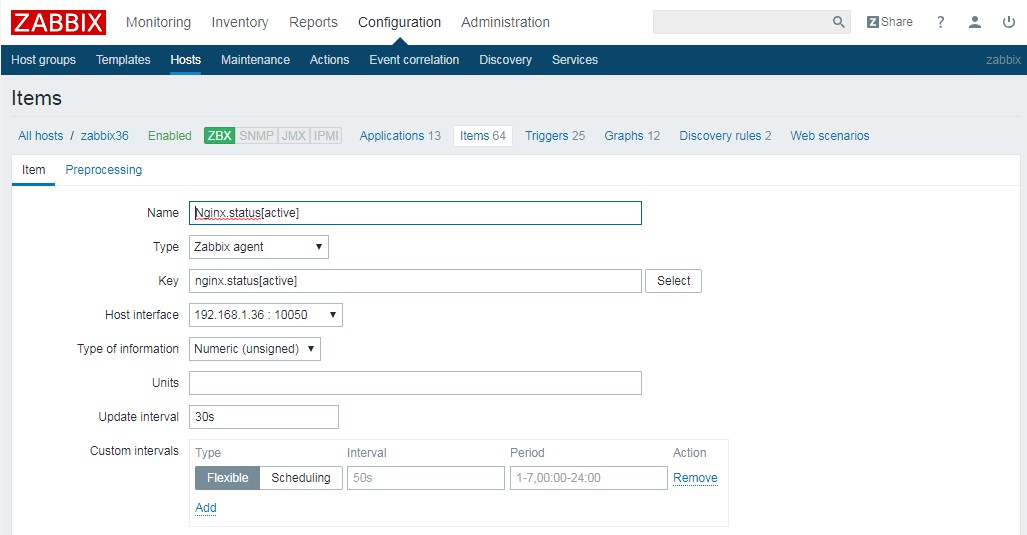
Update interval:监控项刷新时间间隔(一般不要低于60秒)
Custom intervals:自定义时间间隔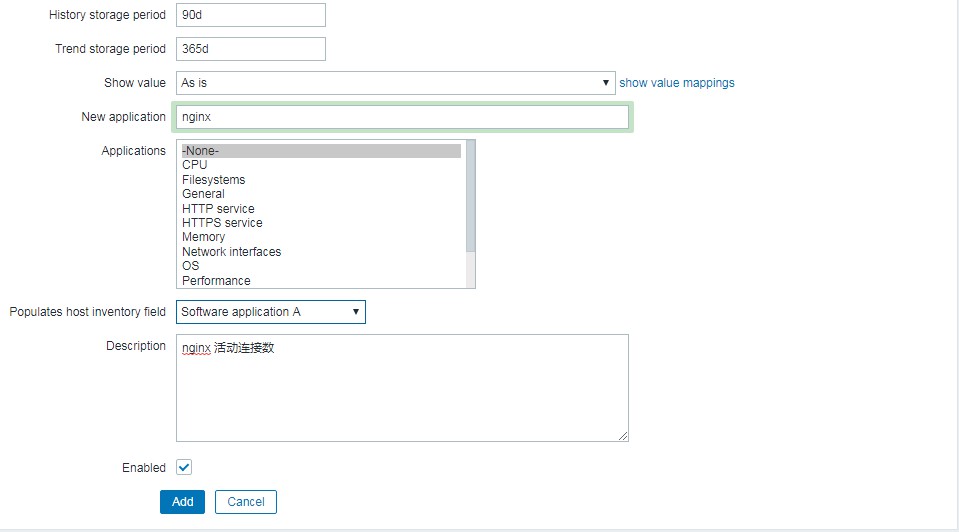
History storage period:历史数据存储多久
Trend storage perod:趋势图存储多久
New application:应用名
Populates host inventory field : 资产类型
Configuration > Hosts > items > APPLICATIONS:nginx > Nginx.status[active] > clone
修改其他的Name,Key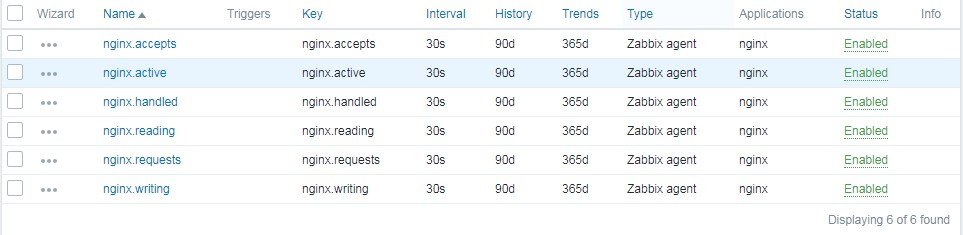
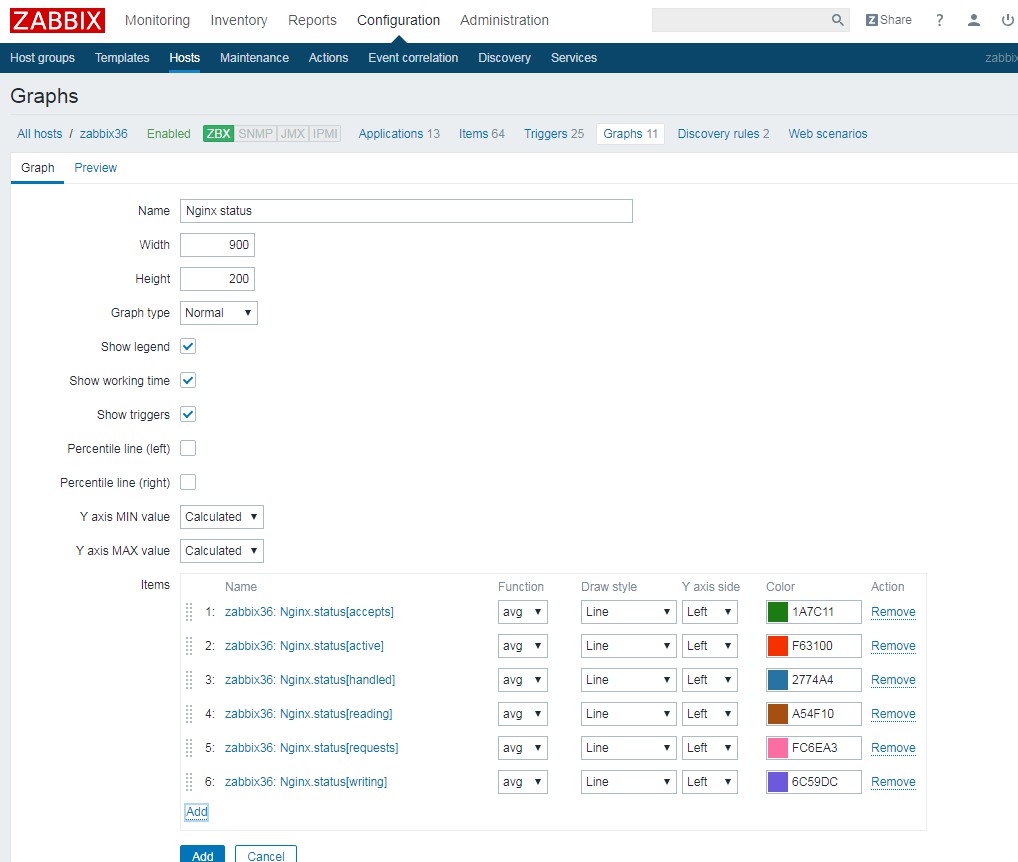
创建图形 Graphs
Configuration > hosts > Graphs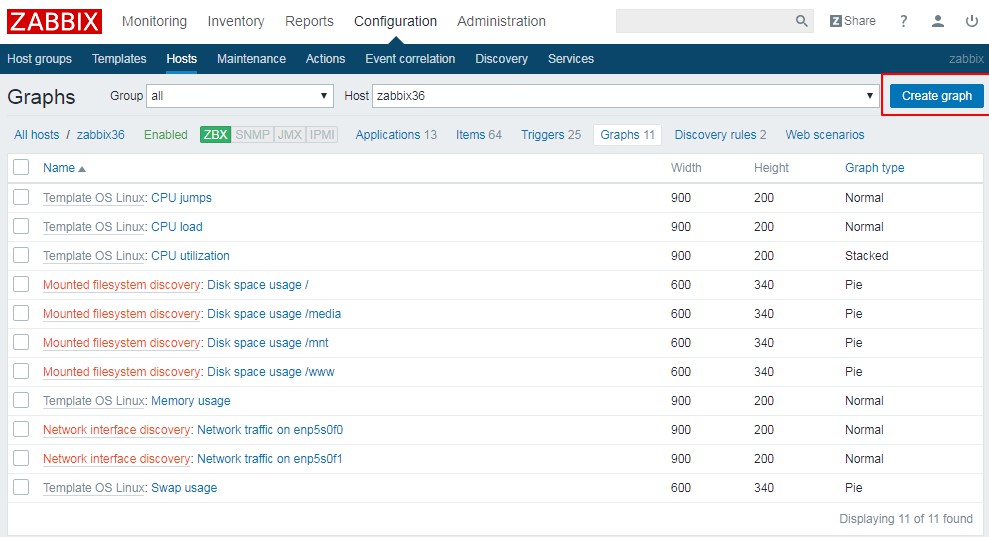
ab -c 100 -n 1000 https://www.sundayhk.com/index.php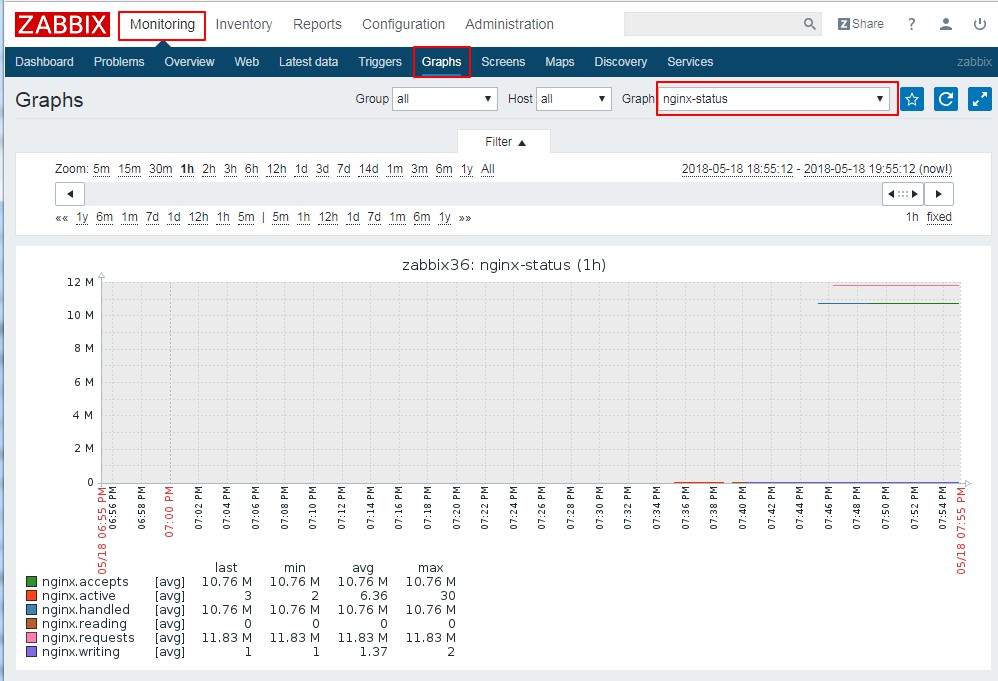
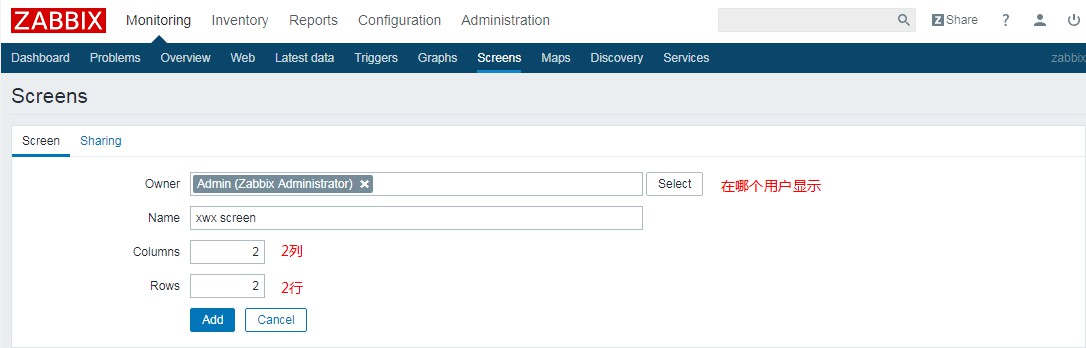
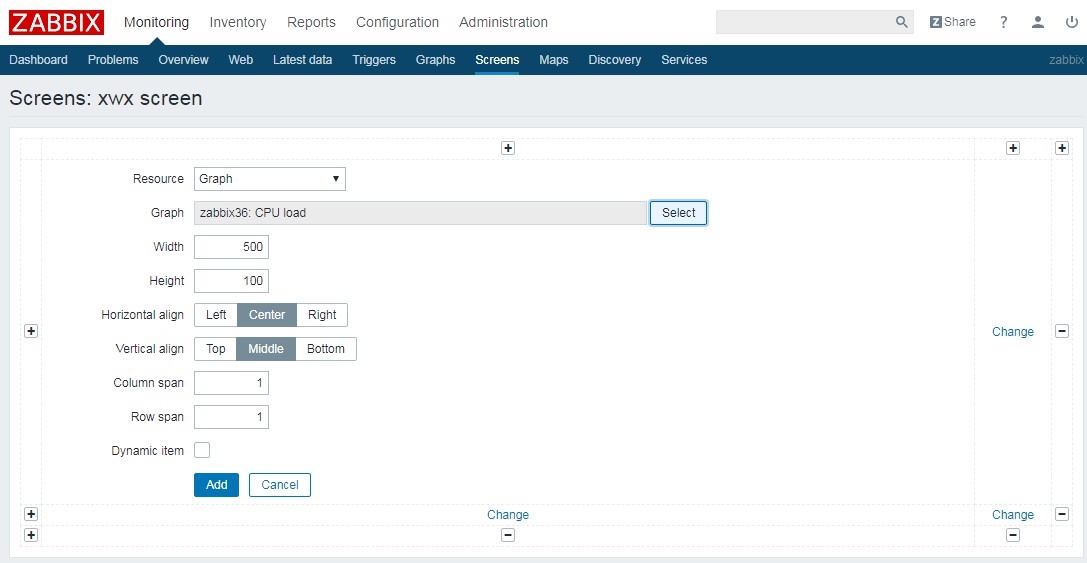
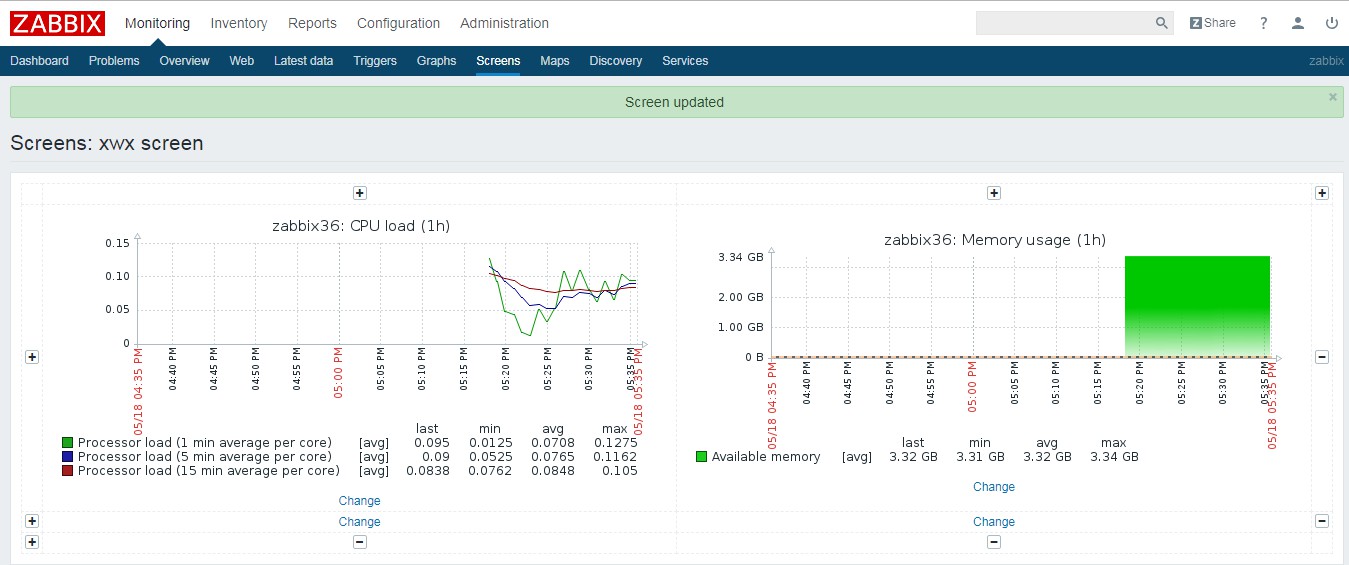
创建聚合图形 Screens
Monitoring > Screens > Create screen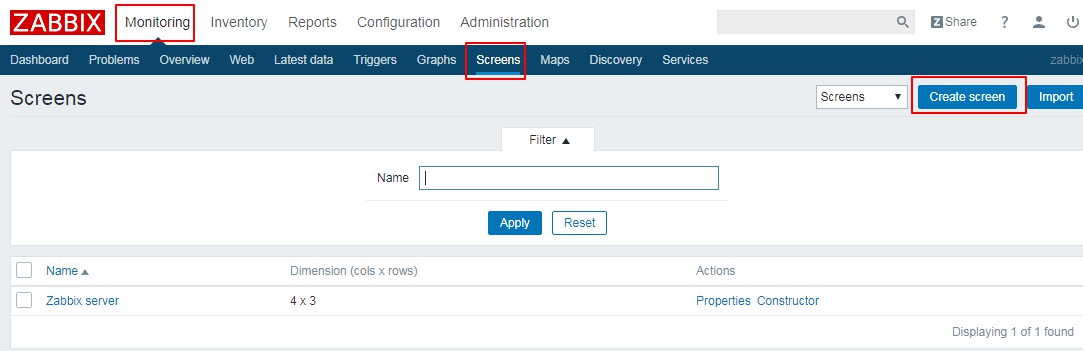
点击xwx screen > Edit screen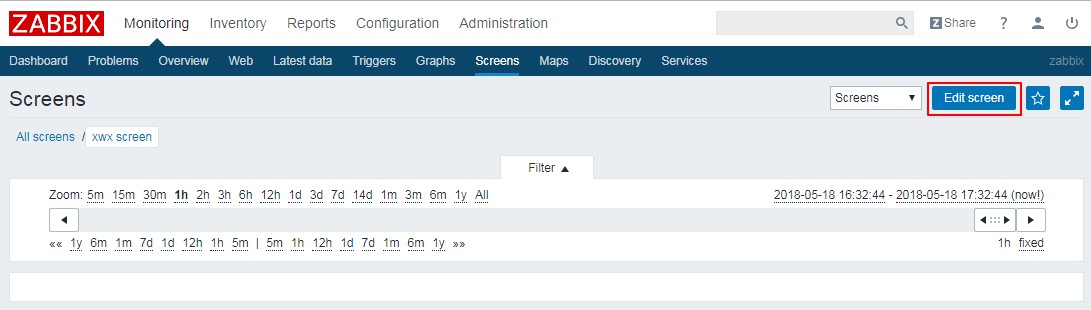
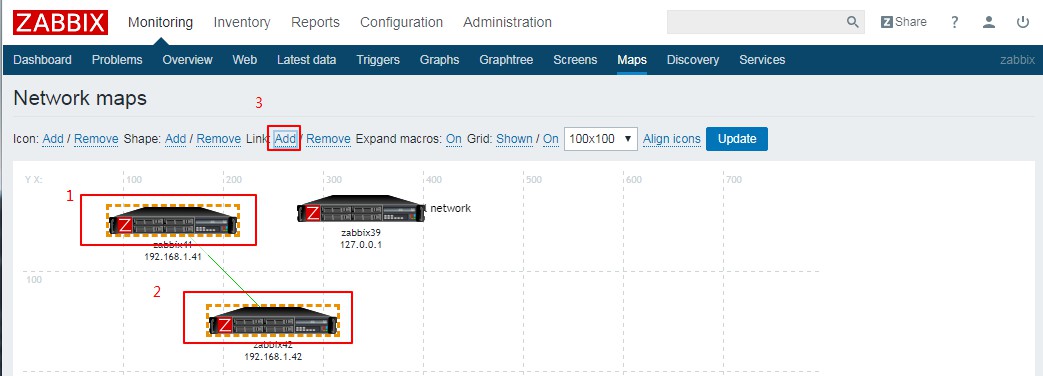
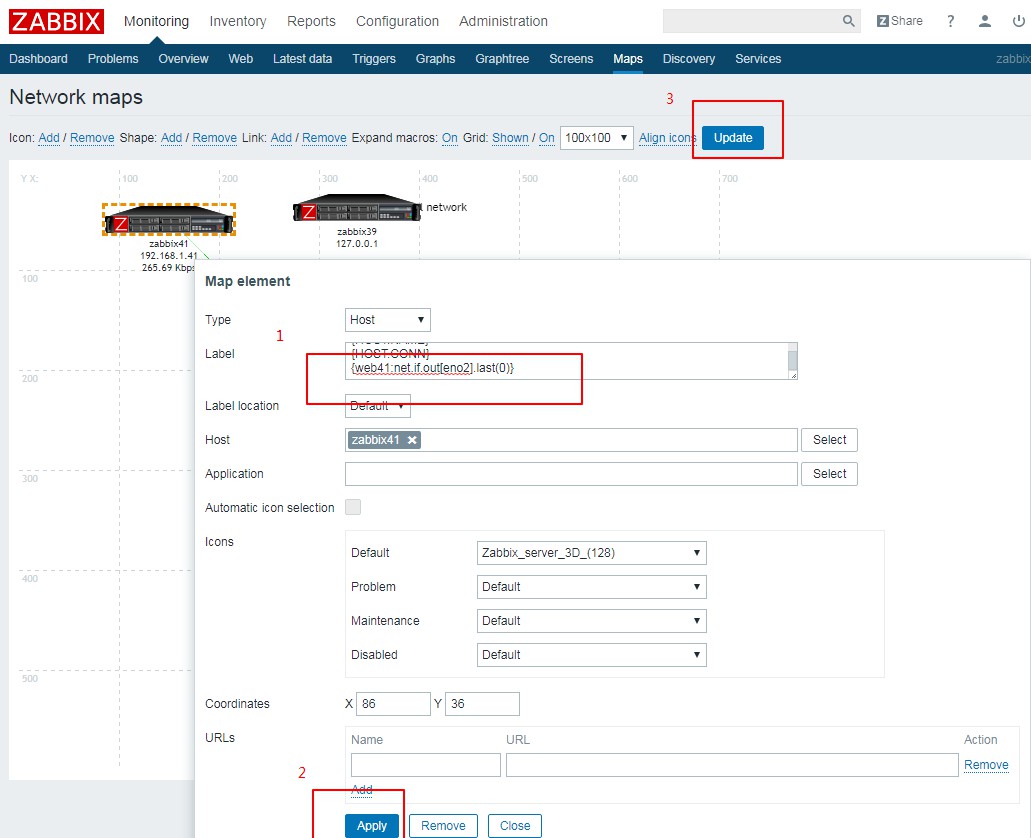
编辑地图 Maps
Monitoring > Maps > Local network > Edit map
显示zabbix41输出到zabbix41 网卡网速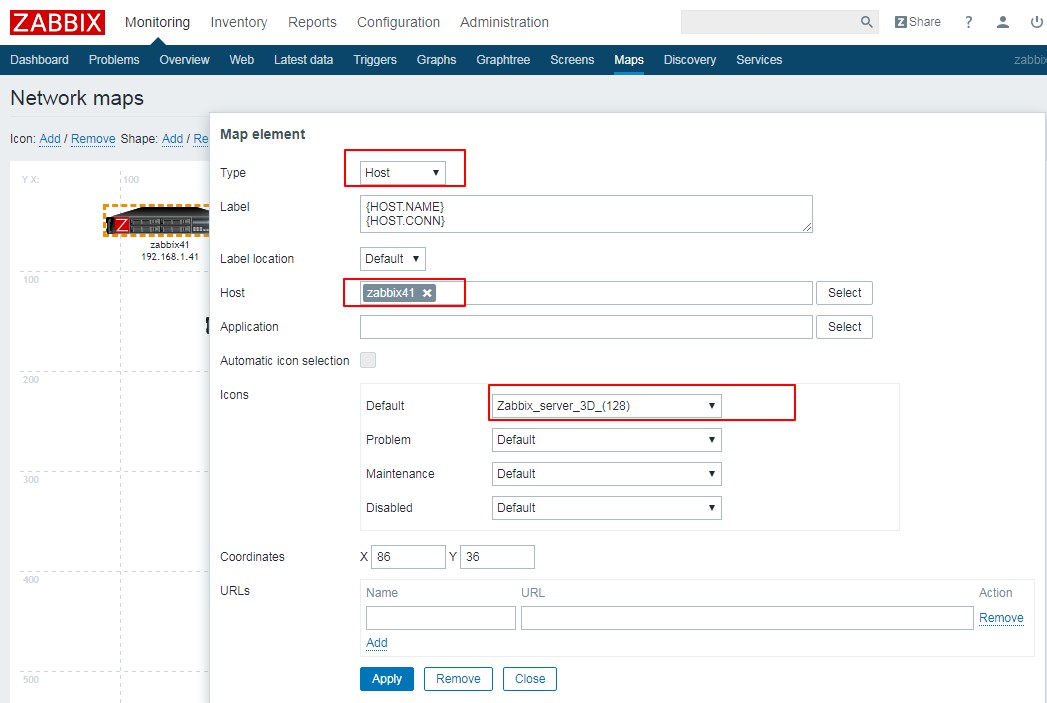
1
2
3
4{web41:net.if.out[eno2].last(0)}
web41:主机名
net.if.out[out2]: item.key 网卡2输出
last{0} 获取最新数据
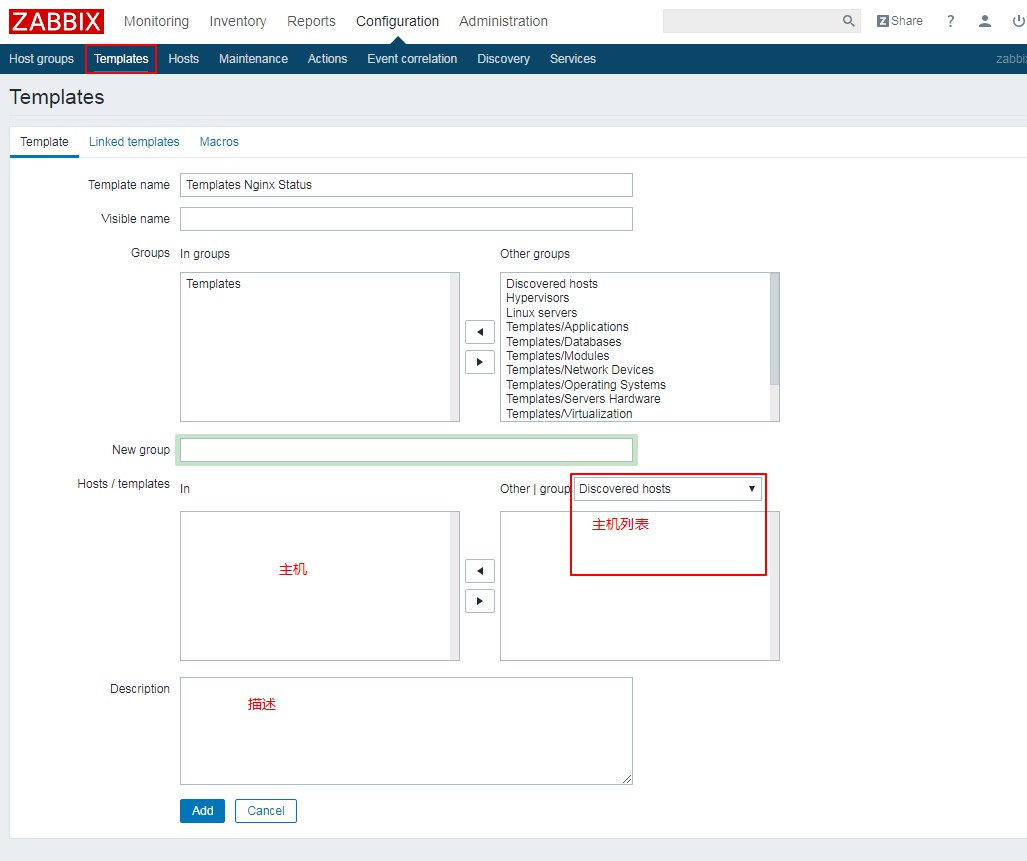
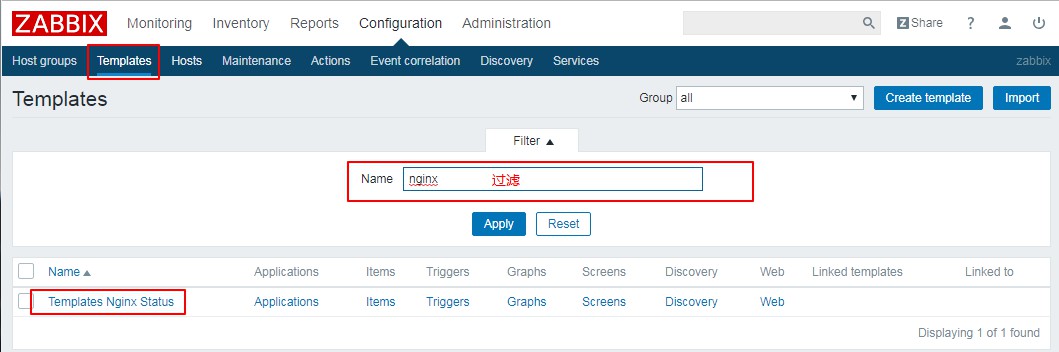
创建模板
Configuration > Templates > Create Templates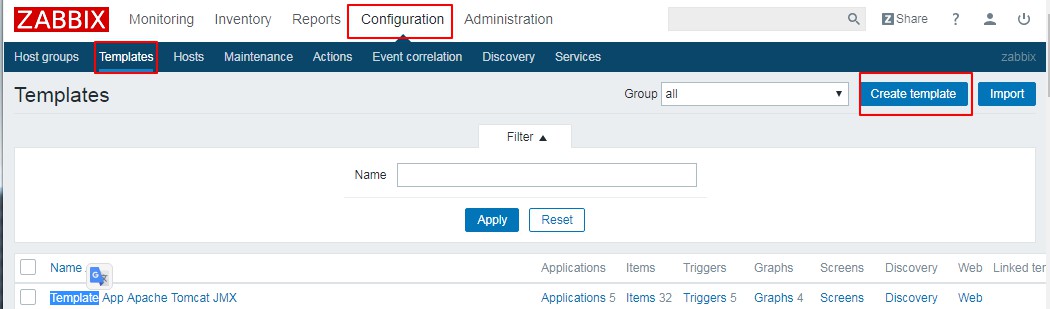
中文显示乱码
zabbix对中文的支持不是很好,但为了管理方面有时候我们还是会选择中文,在zabbix监控的web界面,图形图标下面的中文会显示一个个小方块,这样是不正确的,需要下载字体。
如将C:\Windows\Fonts\Microsoft YaHei UI\Microsoft YaHei UI 常规 复制出来命名为”msyh.ttf”上传到/zabbix/fonts/字体下
修改/www/web/zabbix/include/defines.inc.php文件中的两处1
2define('ZBX_GRAPH_FONT_NAME', 'DejaVuSans');
define('ZBX_FONT_NAME', 'DejaVuSans');
修改成1
2define('ZBX_GRAPH_FONT_NAME', 'msyh');
define('ZBX_FONT_NAME', 'msyh');
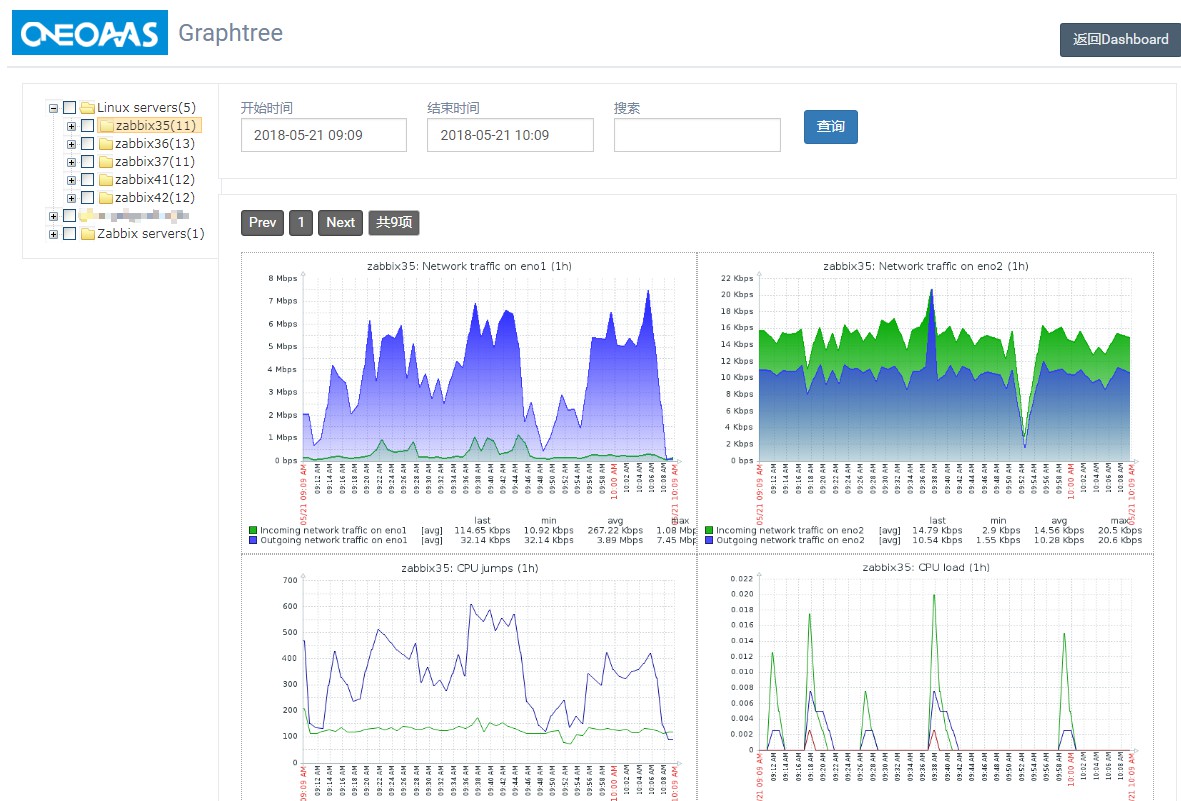
安装Graphtree
https://github.com/OneOaaS/graphtrees
zabbix-web目录:/www/web/zabbix1
2
3
4
5
6cd /www/web/zabbix
wget https://raw.githubusercontent.com/OneOaaS/graphtrees/master/graphtree3.0.4.patch
#yum install patch -y
#apt-get install patch -y
patch -Np0 <graphtree3.0.4.patch
chown -R www.www oneoaas
查看
Monitoring > Graphtree
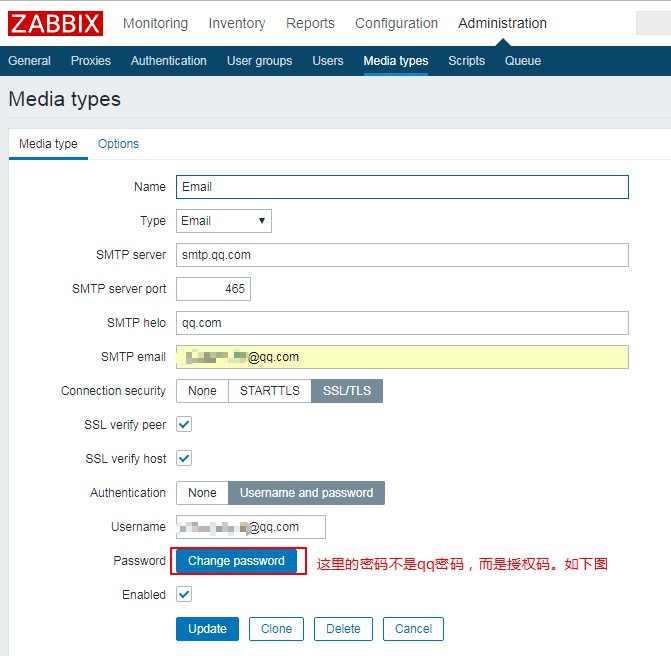
邮件报警
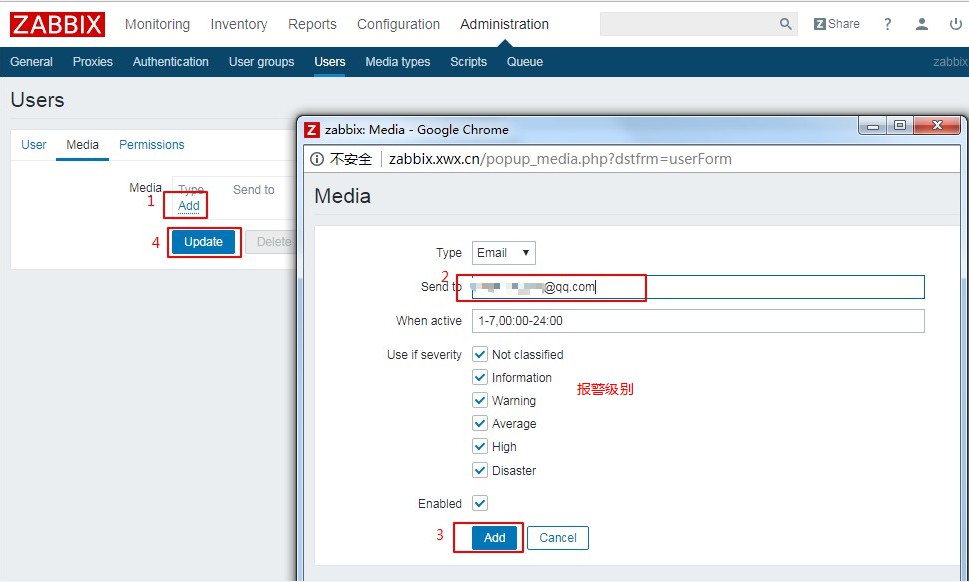
设置报警媒介
Administrator > Media types > email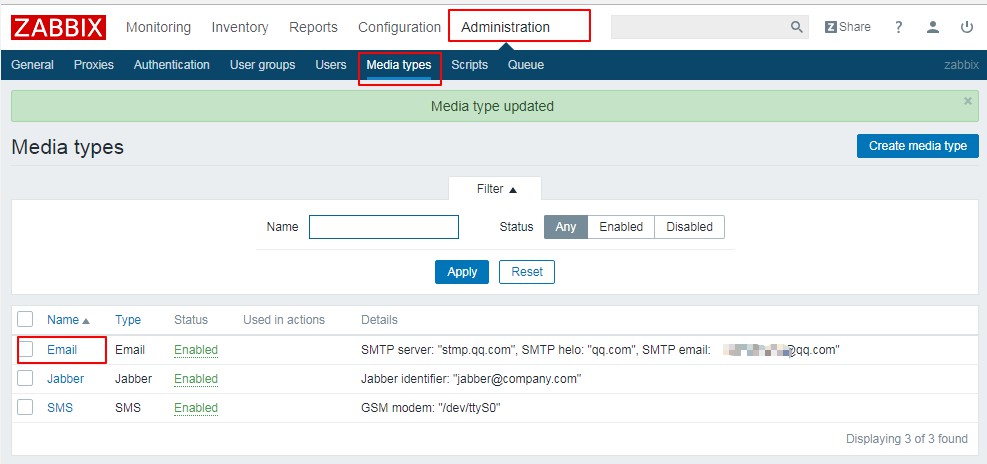


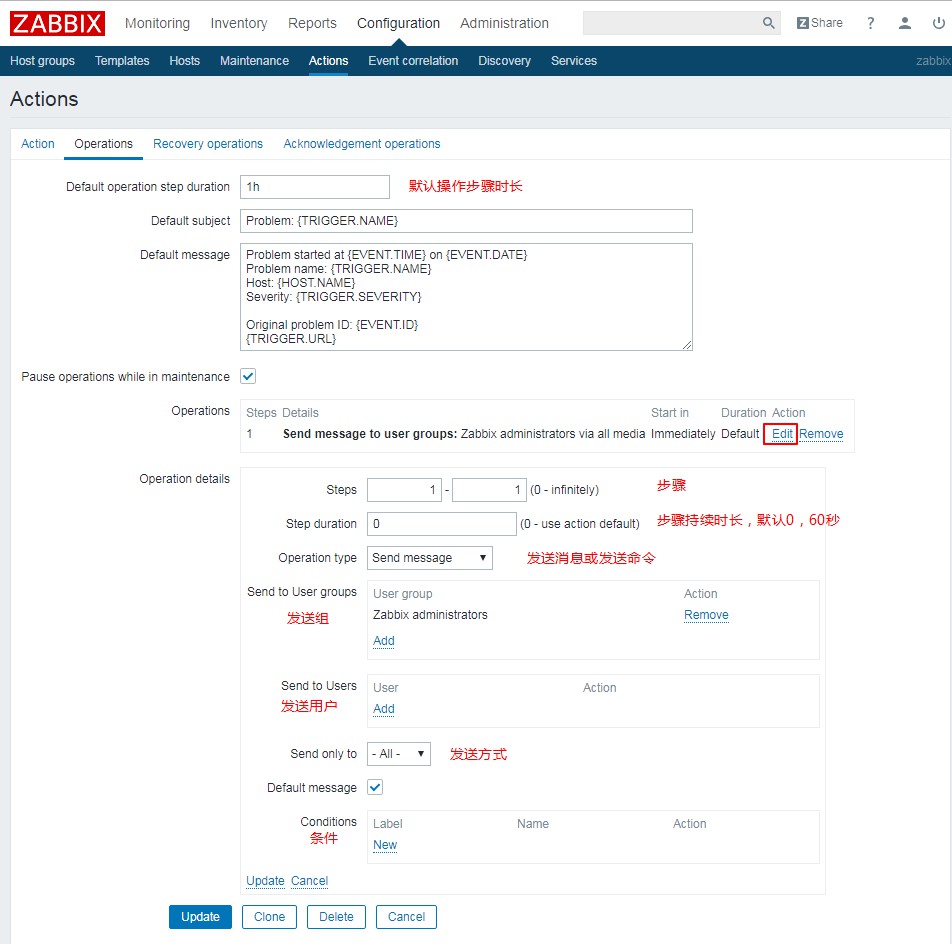
设置发送邮件动作
Configuration > Actions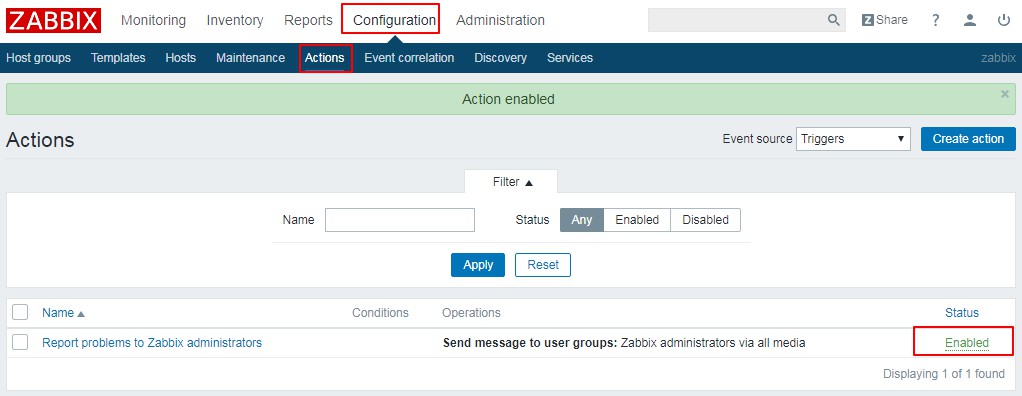
设置收件人
Administration > User > Admin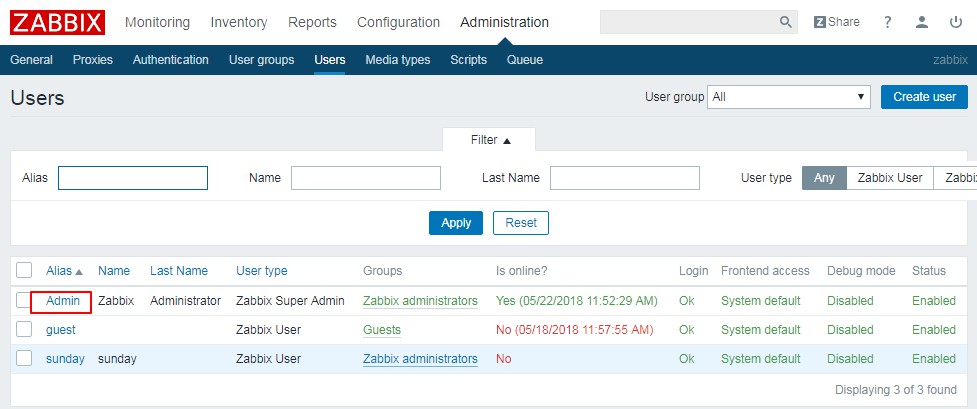
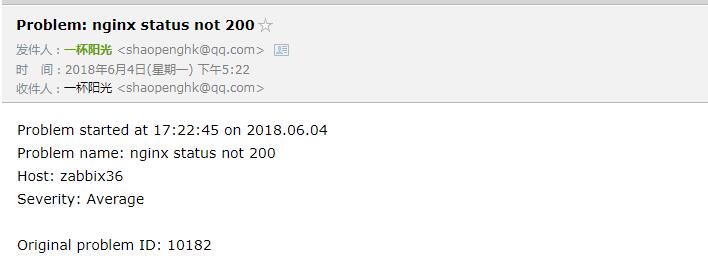
测试:关闭http或监控WEB实例 将200修改201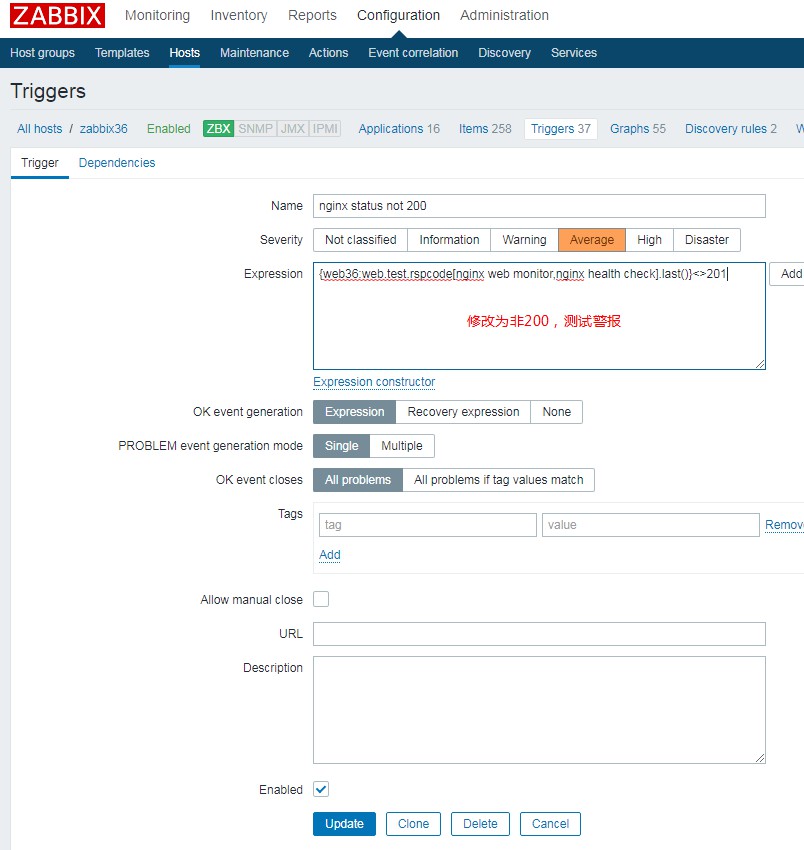
邮件报警方式2(脚本)
zabbix-server操作
vim /etc/zabbix/zabbix_server.conf
AlertScriptsPath=/etc/zabbix/alertscripts
邮件配置
/etc/zabbix/alertscripts# cat mailx.sh
1 |
|
chmod +x /etc/zabbix/alertscripts/mailx.sh
chown zabbix.zabbix /etc/zabbix/alertscripts/mailx.sh
创建媒体
Administration> Media types> Create media type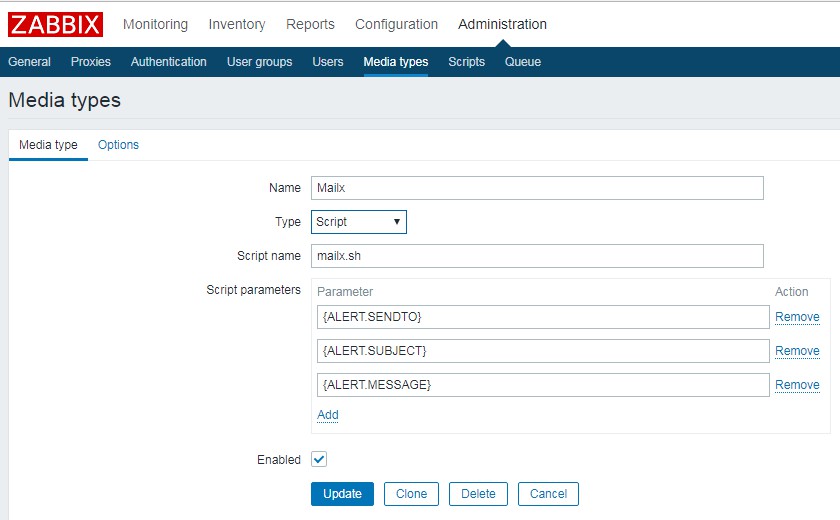
用户选择媒体
Administration> Users> Admin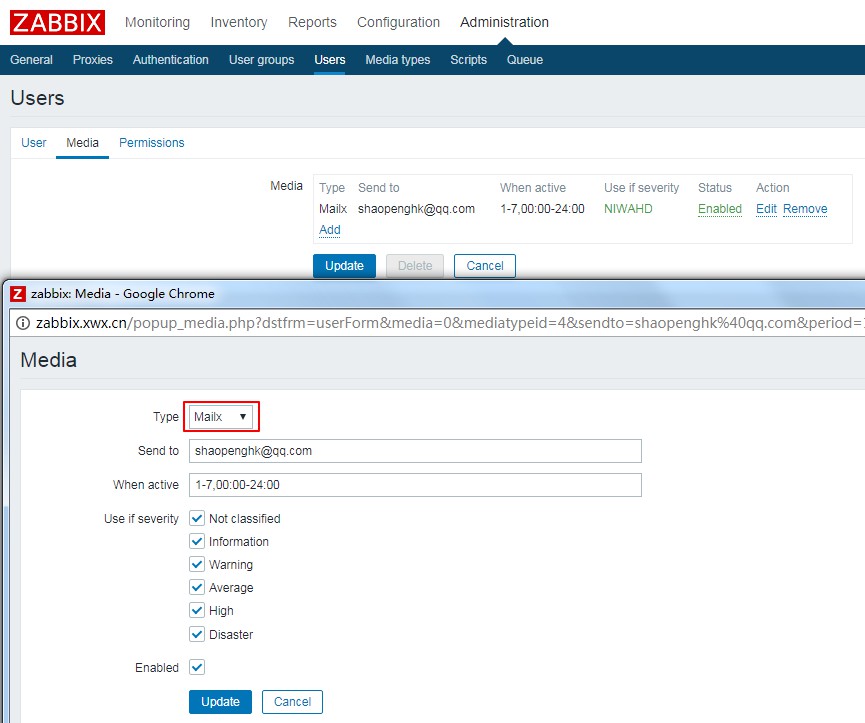
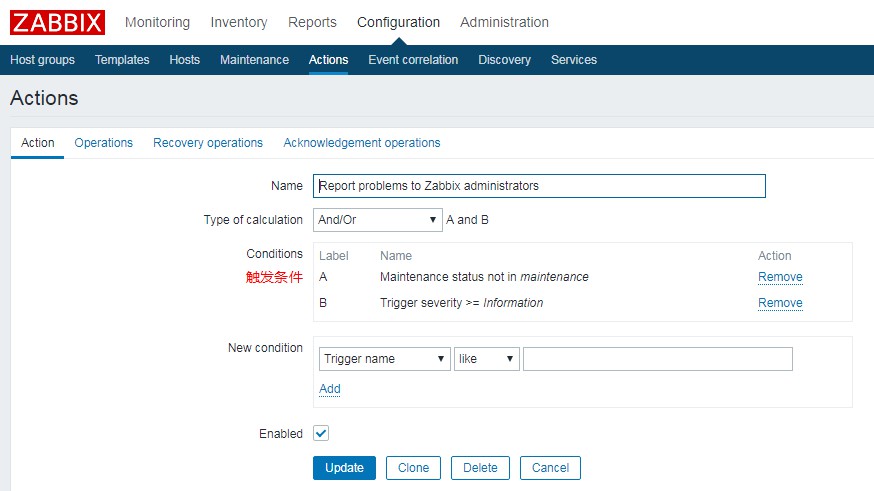
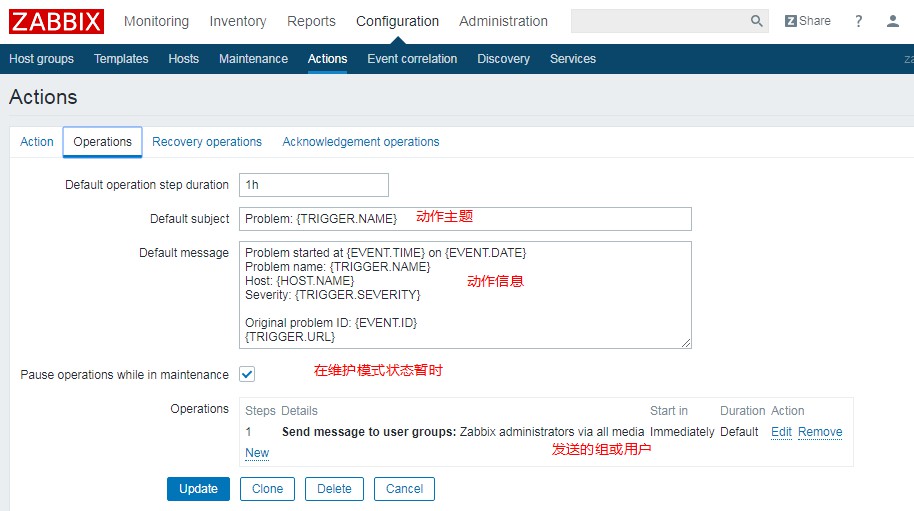
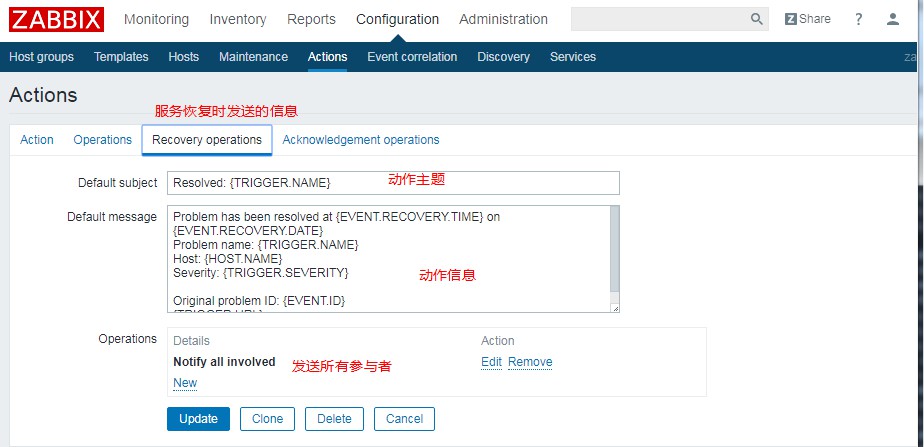
条件和媒体选择
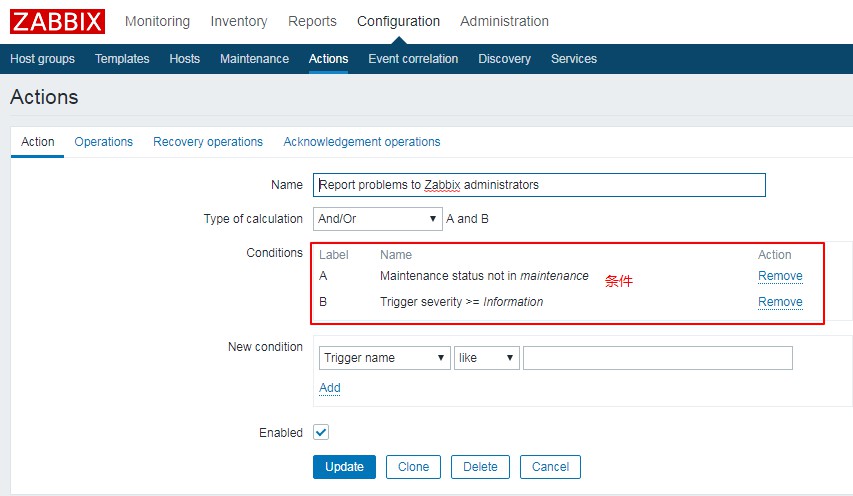
设置动作
Configuration> Actions> Report problems to Zabbix administrators
微信报警
微信企业号申请
注册微信企业号(团队类型) 点击注册 或 注册企业号微信 点击注册
安装组件
1 | apt install python-pip |
下载wechat.py1
2
3git clone https://github.com/X-Mars/Zabbix-Alert-WeChat.git
cp Zabbix-Alert-WeChat/wechat.py /etc/zabbix/alertscripts/
chmod +x wechat.py && chown zabbix:zabbix wechat.py
调试wechat.py
1 | #!/usr/bin/python2.7 |
修改1-5
测试
/etc/zabbix/alertscripts# python wechat.py sunday hello world
2

微信企业号设置
通讯录设置
登陆微信企业号控制台
点击左侧“通讯录”,新增部门(技术部)与子部门(运维部),并添加用户
点击(运维部)后方的三角,修改部门,记录部门ID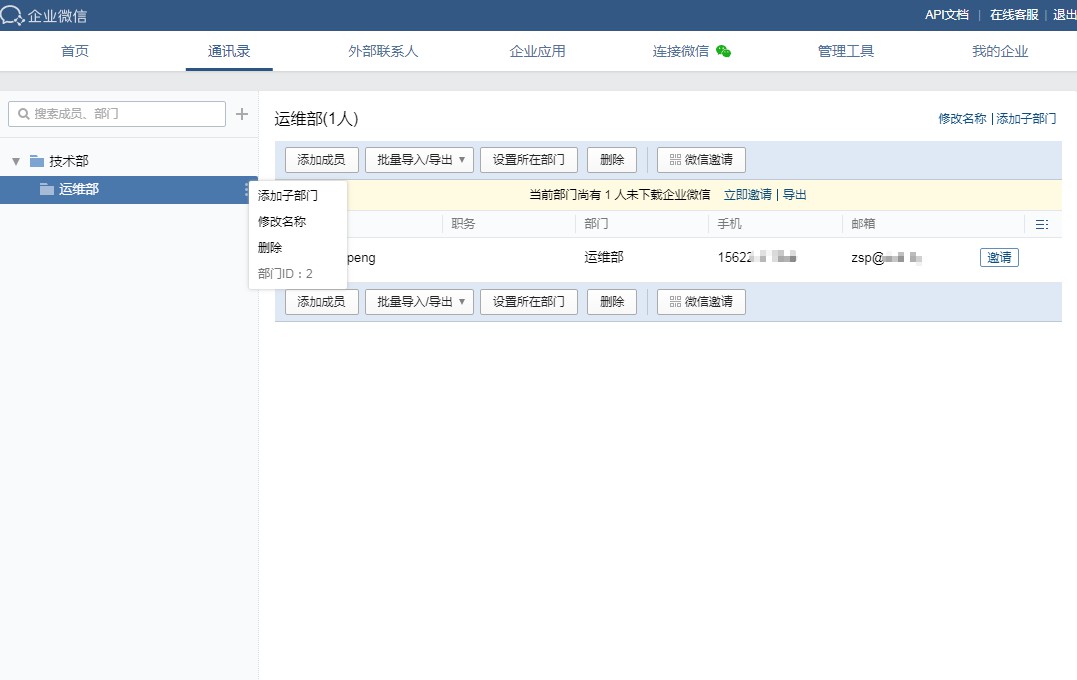
创建应用
点击左侧“企业应用”,创建应用,应用名称为“zabbix报警”
点击“zabbix报警”,“可见范围”,添加刚刚新建的子部门(运维部)
记录Agentld和Secret
应用权限设置
点击左侧“我的企业”,权限管理,新建管理组,名称填写“zabbix报警组”
点击修改“通讯录权限”,勾选(技术部)后方的管理
点击修改“应用权限”,勾选刚刚创建的“zabbix报警”
点击刚刚创建的“zabbix报警组”,记录Secret

我的企业 企业信息 记录CorpID
收集微信相关信息
成员账号
记录应用ID
记录CorpID与Secret
记录子部门(运维部)ID
修改zabbix.conf
vim /etc/zabbix/zabbix_server.conf
/etc/init.d/zabbix-server restart
zabbix web设置
添加示警媒介
Administration> Media types> Create media types
名称填写wechat,类型选择脚本,脚本名称填写wechat.py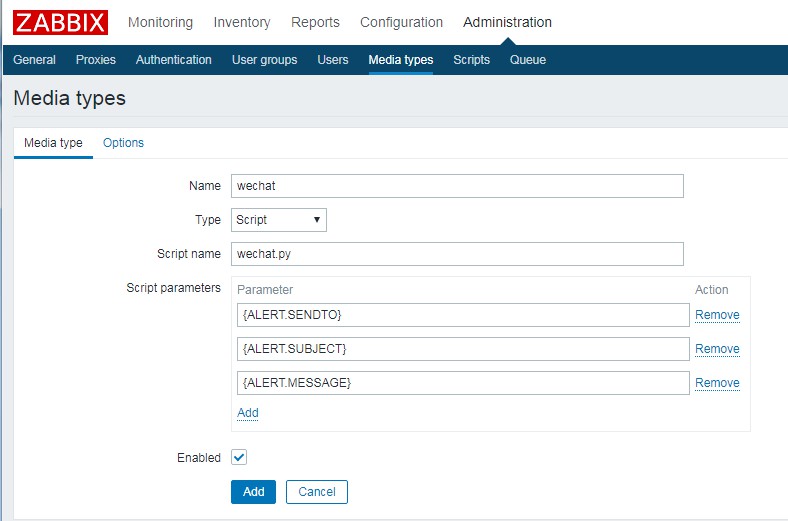 }
}
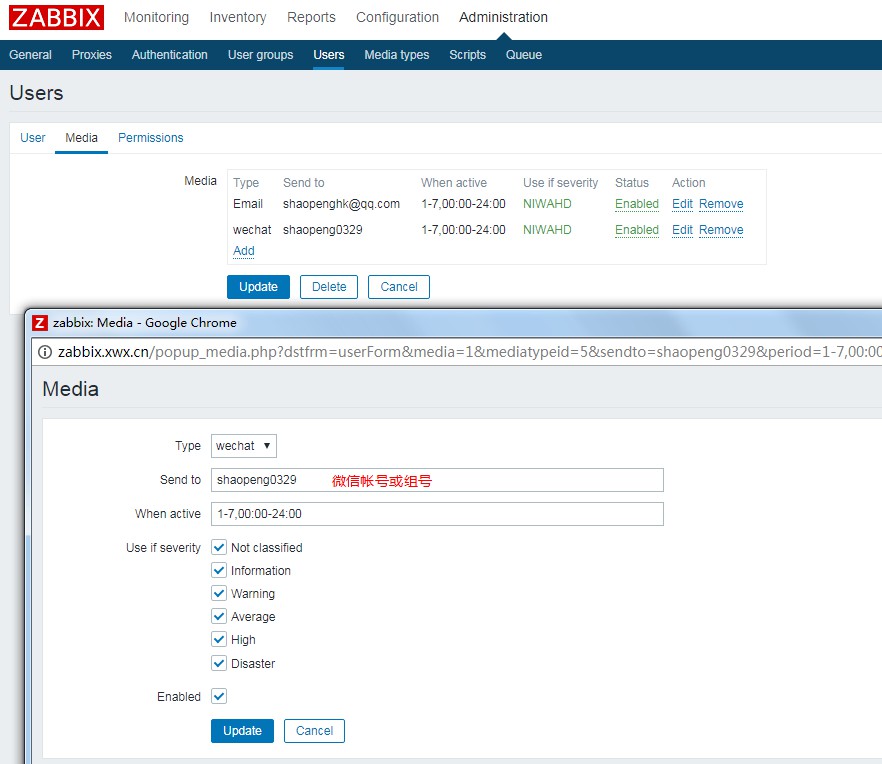
Administration> User> Admin> Media
类型选择wechat,收件人添加微信企业号通讯录内的微信帐号
注:若使用其他用户使用wechat,请设置User Groups: Zabbix administrators,Permissions: Zabbix Super Admin,要不然无法wechat.py。
当然最简单就是使用Admin啦。
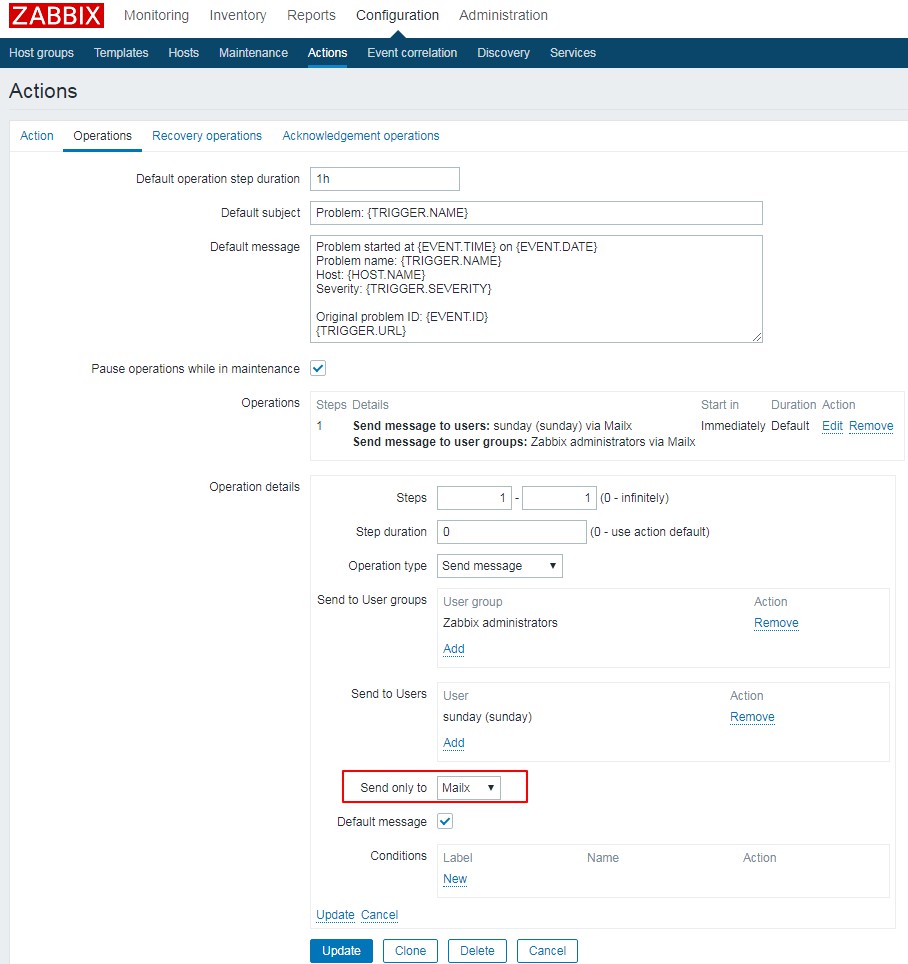
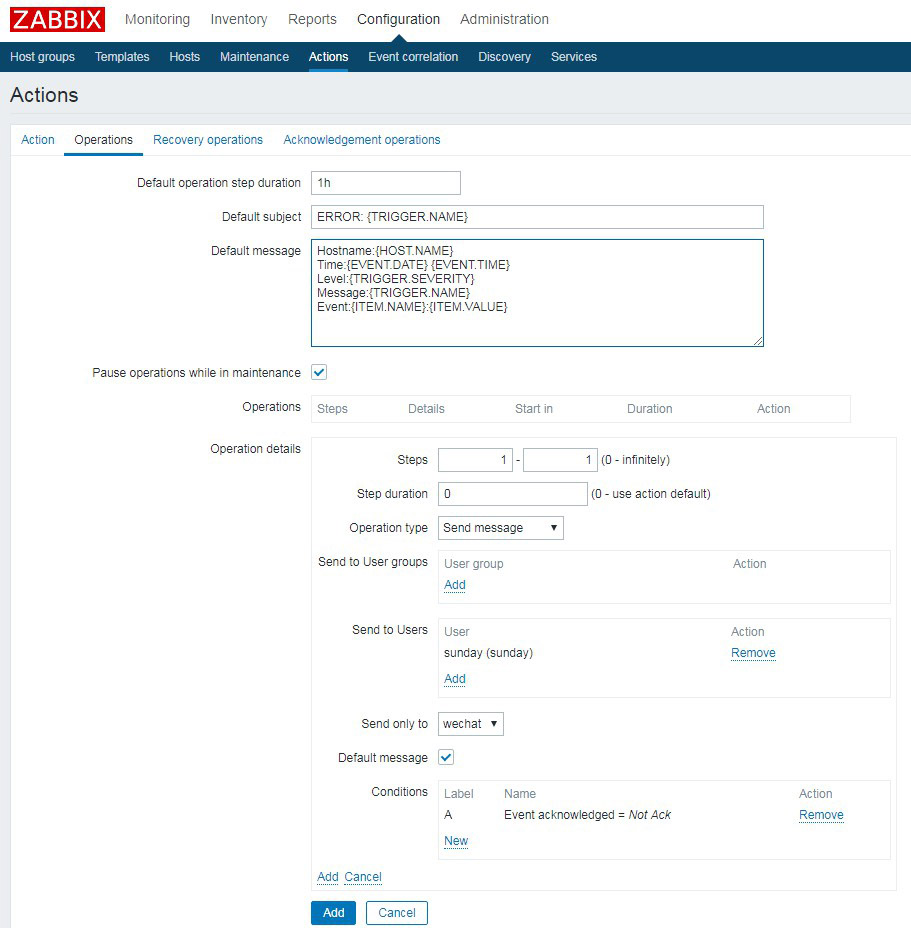
Configuration> Actions> Create action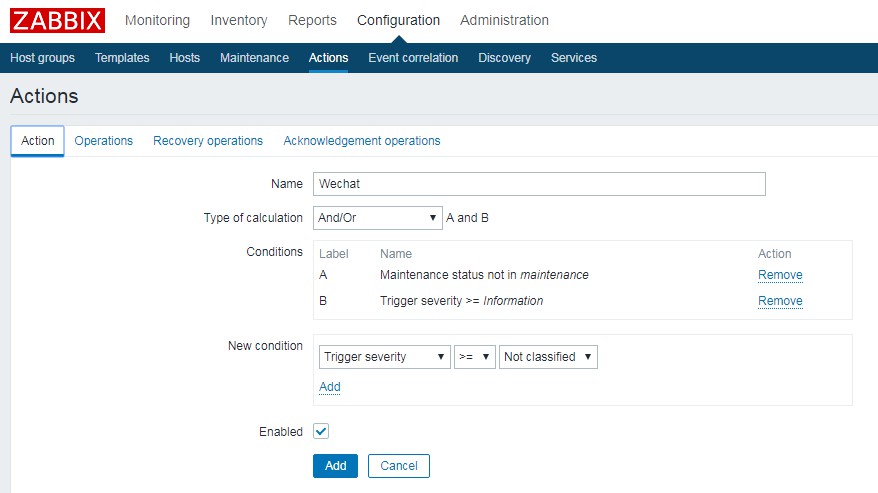
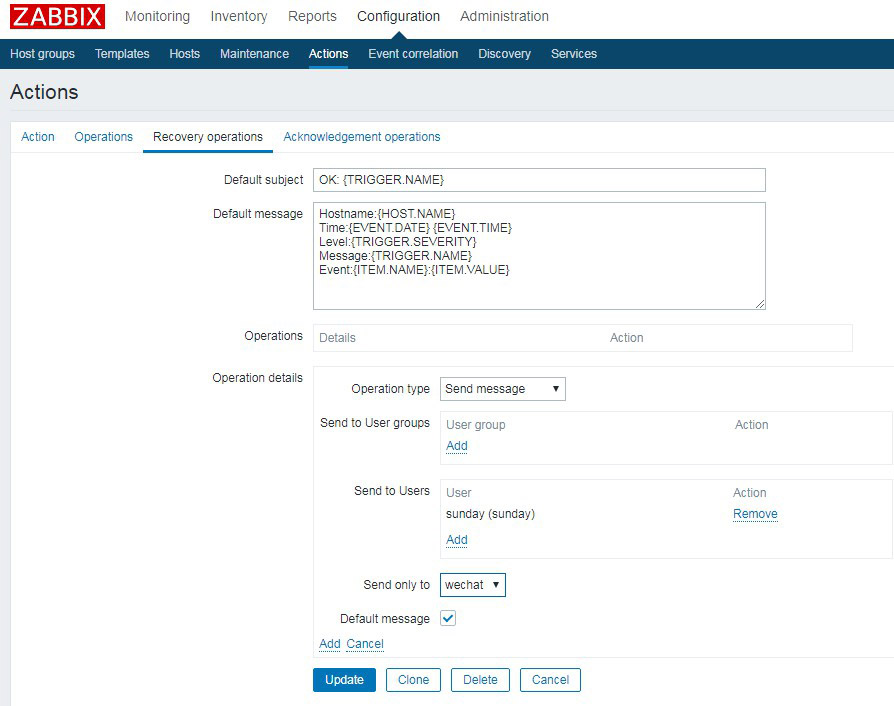
故障信息与恢复信息:1
2
3
4
5Hostname: {HOST.NAME}
Time: {EVENT.DATE} {EVENT.TIME}
Level: {TRIGGER.SEVERITY}
Message: {TRIGGER.NAME}
Event: {ITEM.NAME}:{ITEM.VALUE}
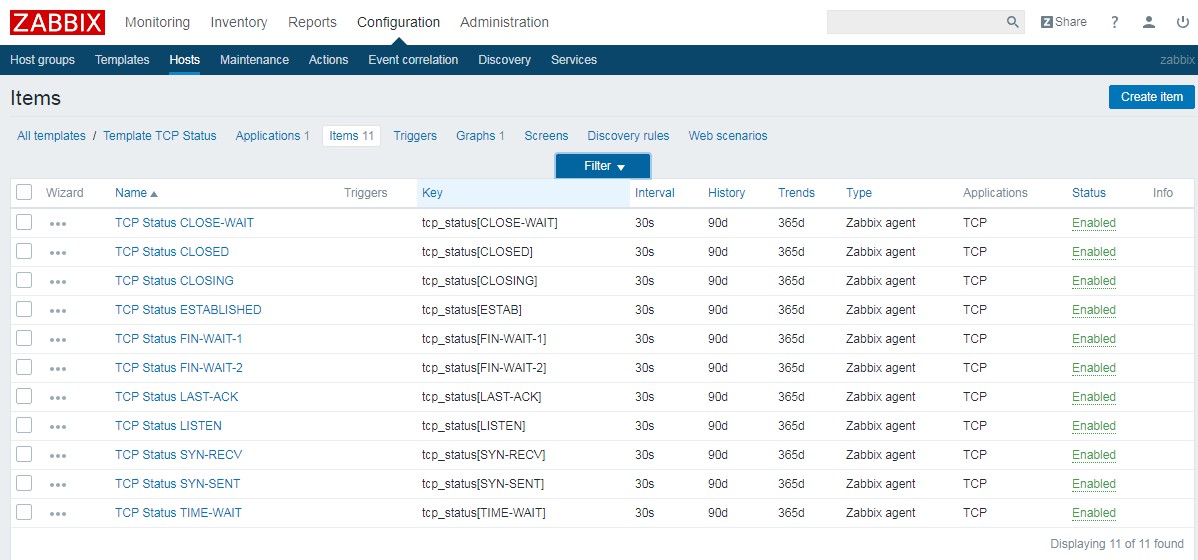
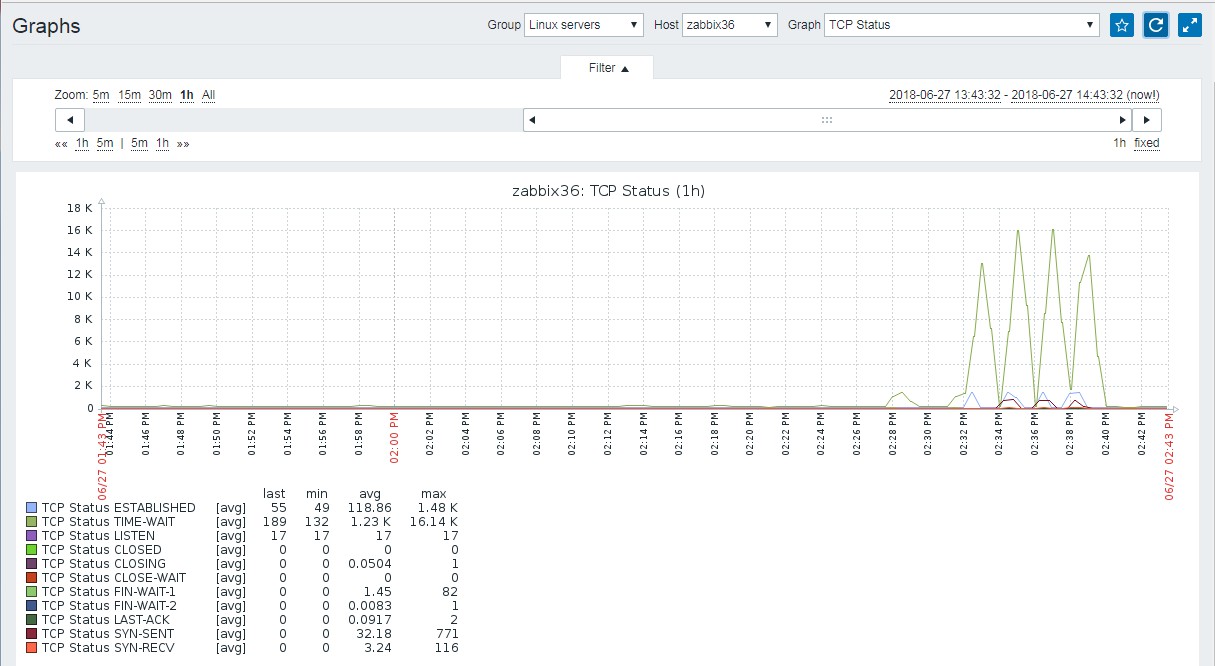
监控TCP状态
cat /etc/zabbix/zabbix_agentd.d/scripts/tcp_status.sh
tcp_status shell 脚本
1 |
|
添加执行权限
chmod +x /etc/zabbix/zabbix_agentd.d/scripts/tcp_status.sh
tcp_status.conf 配置
cat /etc/zabbix/zabbix_agentd.d/tcp_status.conf
重启 zabbbix-agent 修改配置文件重启才会生效的
systemctl restart zabbix-agent
server测试获取agent值
1 | zabbix_get -s 192.168.1.36 -k tcp_status[LISTEN] |
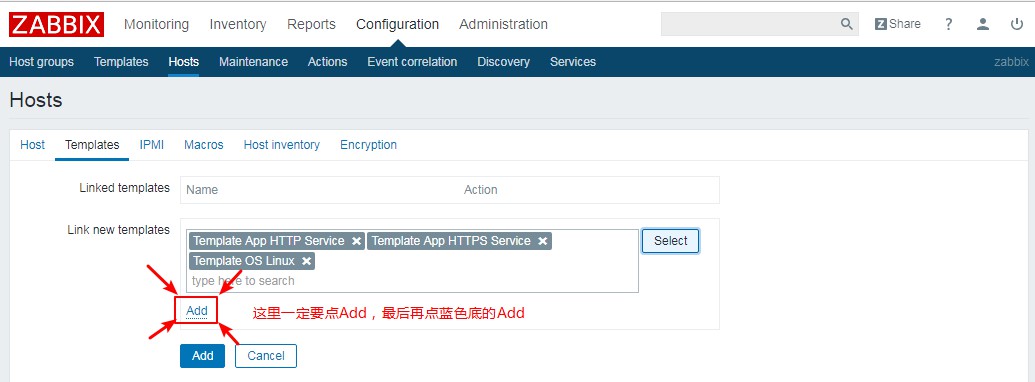
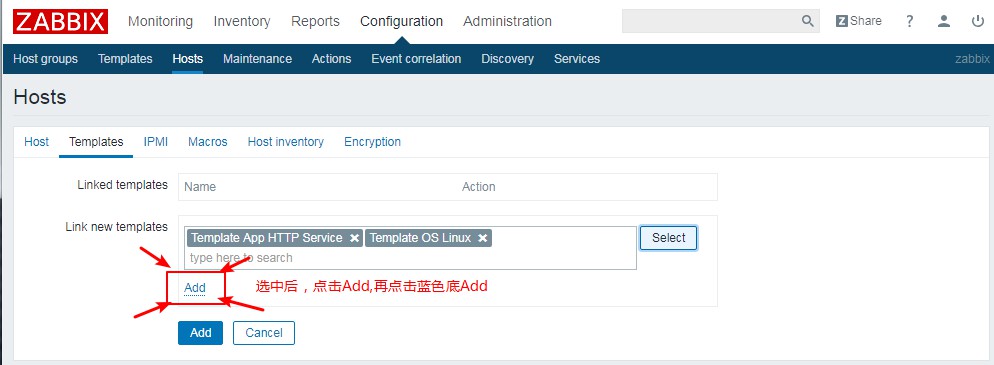
导入模板(3.4) 关联主机
压力测试
ab -c 1000 -n 10000 http://www.sundayle.com/index.php
图表效果
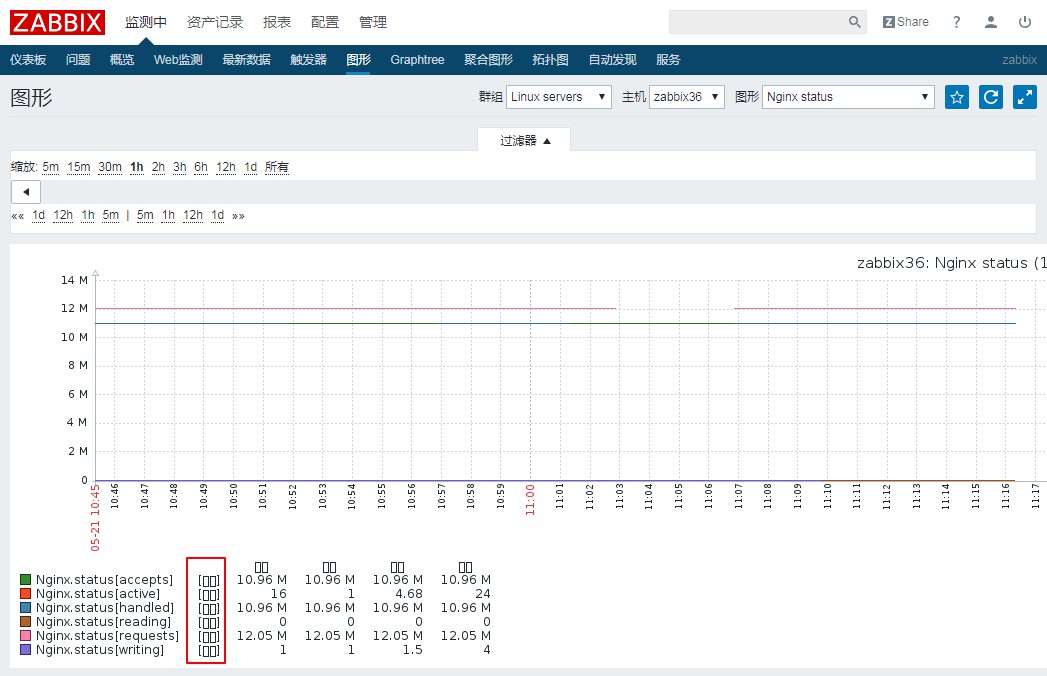
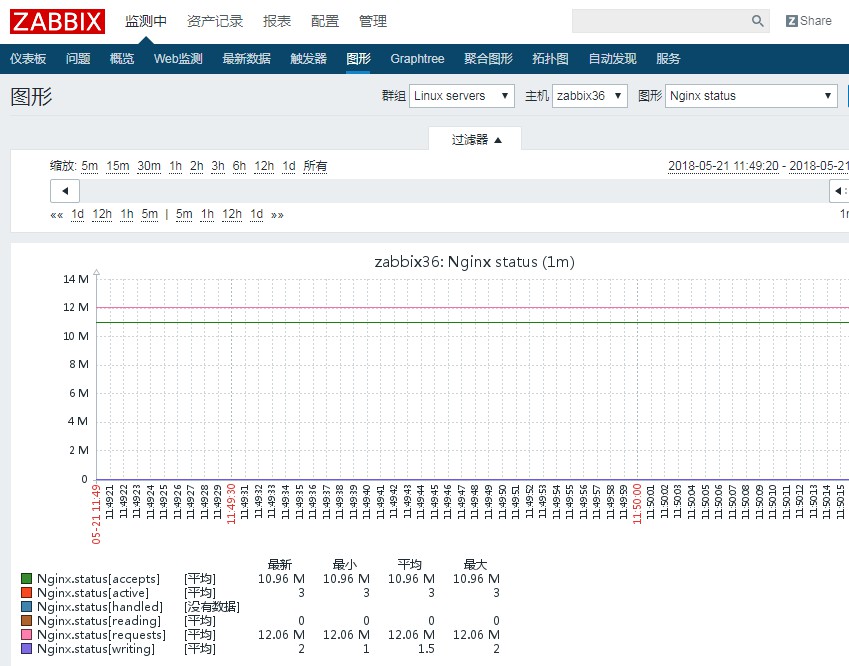
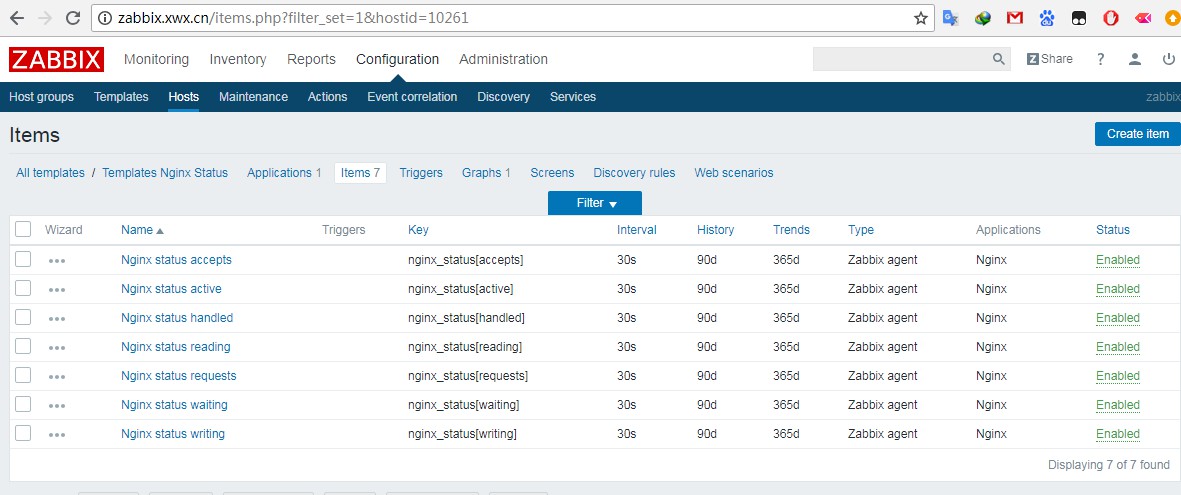
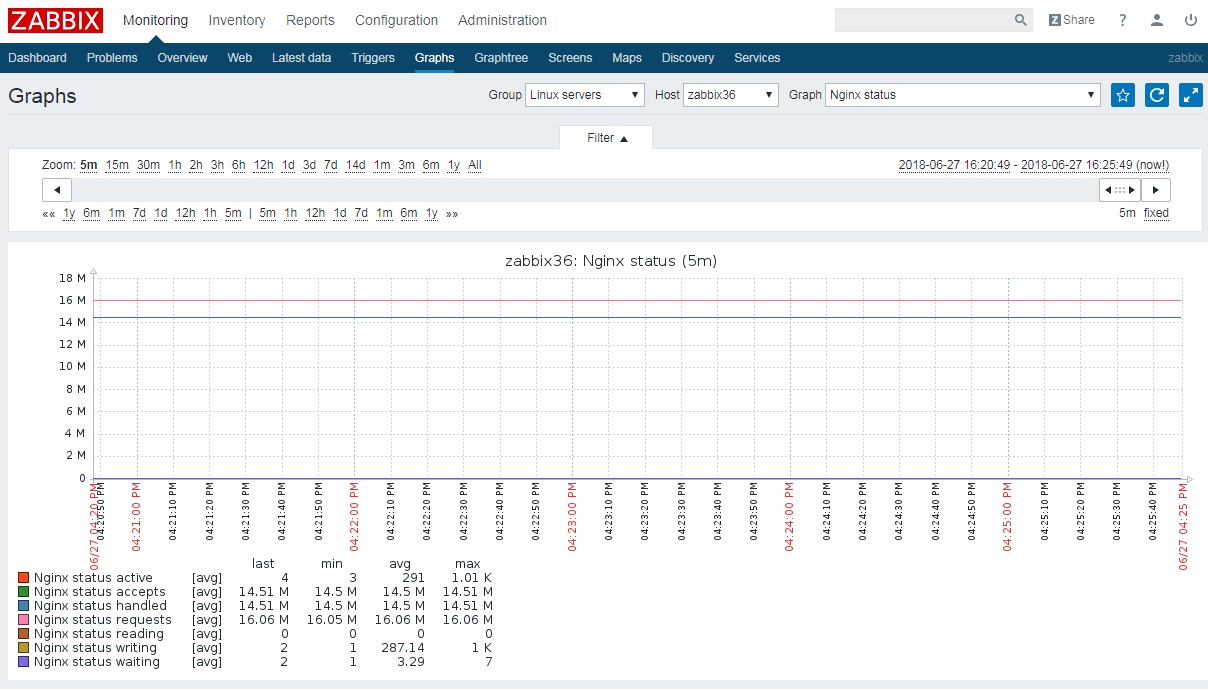
监控Nginx Status
启用Nginx Status
1 | cat /etc/nginx/vhost/nginx_status.conf |
访问Nginx Status
1 | curl http://localhost/nginx_status |
Nginx状态解释
1 | Active connections Nginx正处理的活动链接数1个 |
Nginx Status脚本
cat /etc/zabbix/zabbix_agentd.d/scripts/nginx_status.sh
1 |
|
chmod +x /etc/zabbix/zabbix_agentd.d/scripts/nginx_status.sh
监控项nginx_status.conf配置
cat /etc/zabbix/zabbix_agentd.d/nginx_status.conf
重启zabbix_agent
systemctl restart zabbix-agent
Server zabbix_get 获取值
zabbix_get -s 192.168.1.36 -k nginx_status[accepts]
14496190
导入模板 关联主机
效果图
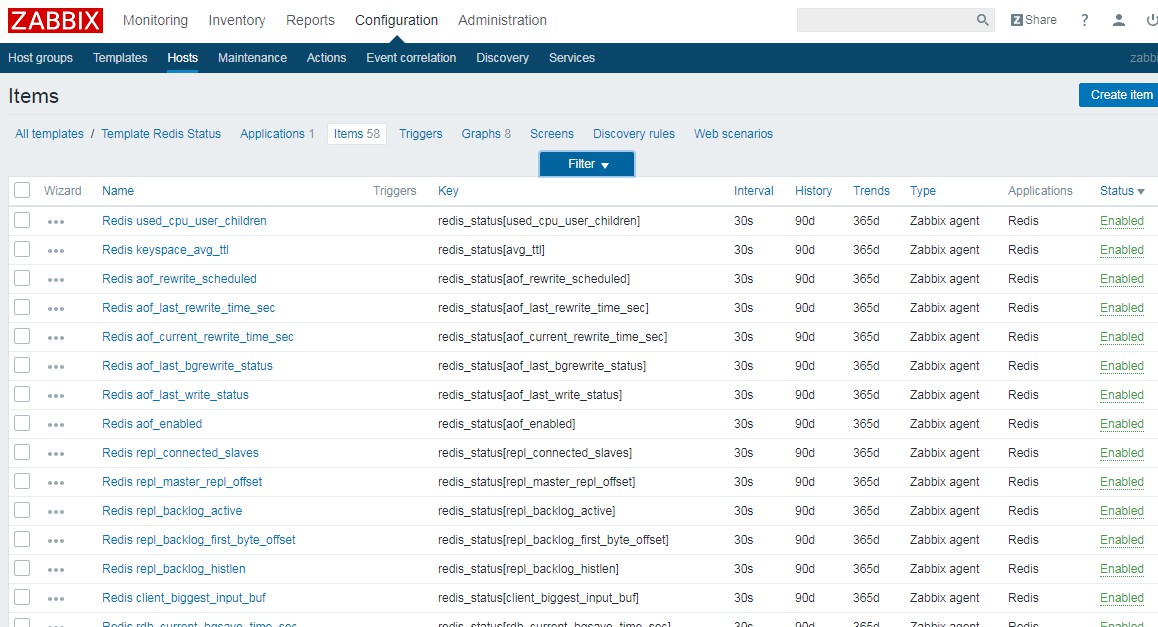
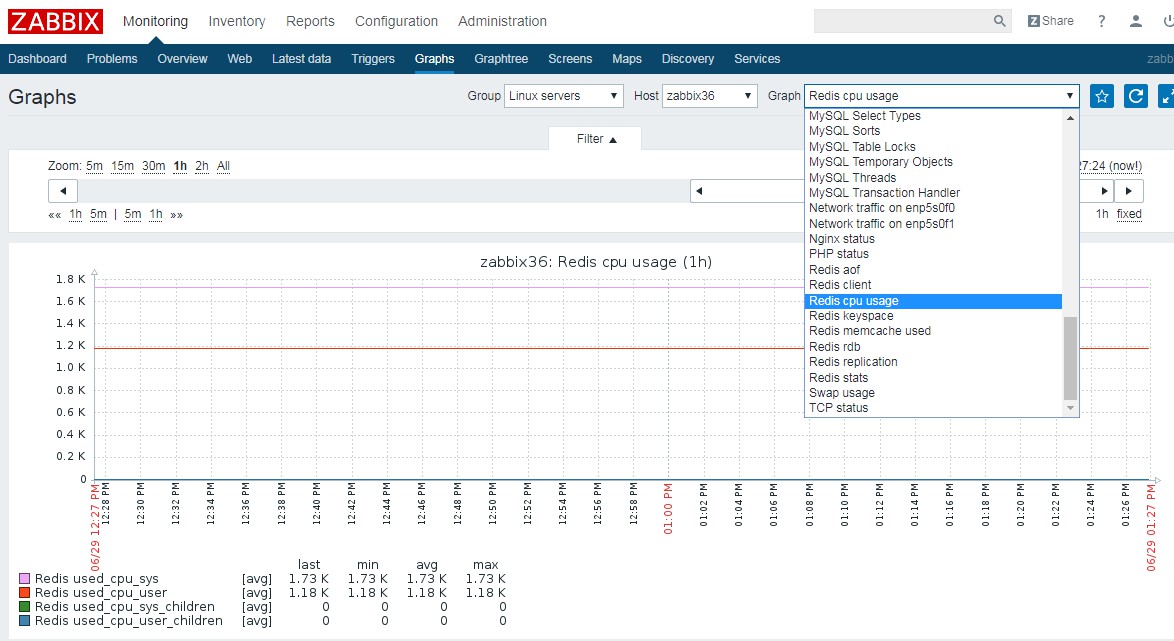
监控Redis
监控脚本
1 | #auther: sunday |
Redis状态参数解释
1 | server : Redis 服务器信息,包含以下域: |
添加执行权限 安装nc
chmod +x /etc/zabbix/zabbix_agentd.d/scripts/redis_status.sh
监控项redis_status.conf配置
cat /etc/zabbix/zabbix_agentd.d/redis_status.conf
重启zabbix_agent
systemctl restart zabbix-agent
Server zabbix_get 获取值
zabbix_get -s 192.168.1.36 -k redis_status[used_cpu_sys]
1706.41
导入模板(3.4) 关联主机
效果图
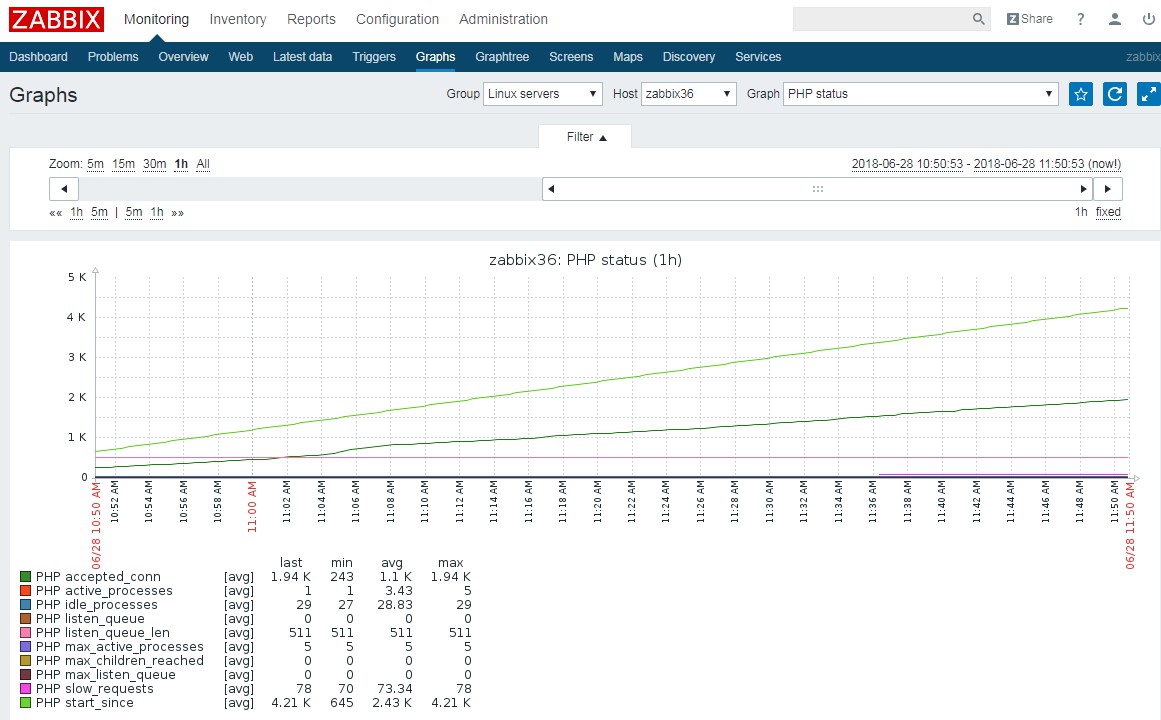
监控PHP-FPM
php_statusfpm开启status
vim /etc/php7/php-fpm.d/www.conf
配置nginx
1 | location ~ ^/(php_status)$ { |
访问测试
curl http://localhost/php_status
2
3
4
5
6
7
8
9
10
11
12
13
14
process manager: static
start time: 27/Jun/2018:17:47:24 +0800
start since: 160
accepted conn: 15
listen queue: 0
max listen queue: 0
listen queue len: 511
idle processes: 29
active processes: 1
total processes: 30
max active processes: 1
max children reached: 0
slow requests: 0
PHP-FPM状态解释
1 | pool #fpm池名称,大多数为www |
phpfpm shell
1 | #!/bin/bash |
chmod +x /etc/zabbix/zabbix_agentd.d/scripts/php_status.sh
监控项nginx_status.conf配置
cat /etc/zabbix/zabbix_agentd.d/php_status.conf
重启zabbix_agent
systemctl restart zabbix-agent
Server zabbix_get 获取值
zabbix_get -s 192.168.1.36 -k php_status[accepted_conn]
350
导入模板(3.4) 关联主机
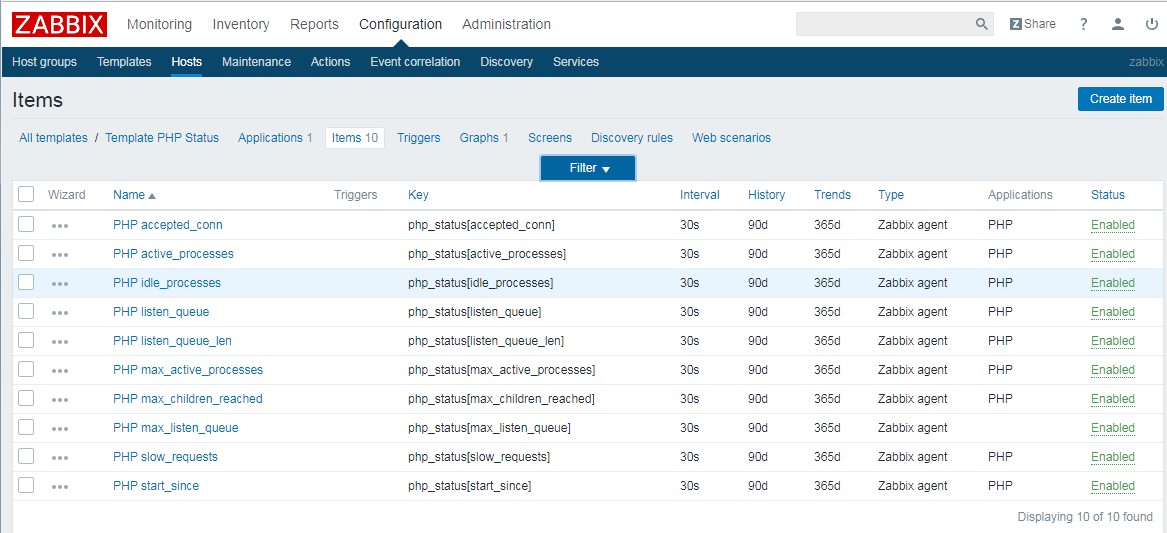
效果图
监控MySQL
#ubuntu
使用Percona Monitoring Plugins for Zabbix
https://www.percona.com/doc/percona-monitoring-plugins/LATEST/zabbix/index.html
Percona Monitoring Plugins 需要安装在agent端(web36)
#ubuntu1
2
3
4wget https://repo.percona.com/apt/percona-release_0.1-4.$(lsb_release -sc)_all.deb
dpkg -i percona-release_0.1-4.$(lsb_release -sc)_all.deb
sudo apt-get update
apt-get install percona-zabbix-templates
#centos1
2yum install http://www.percona.com/downloads/percona-release/redhat/0.1-4/percona-release-0.1-4.noarch.rpm
yum install percona-zabbix-templates
1 | dpkg -L percona-zabbix-templates |
配置zabbix_agent文件
1 | cp /var/lib/zabbix/percona/templates/userparameter_percona_mysql.conf /etc/zabbix/zabbix_agentd.d/userparameter_percona_mysql.conf |
MySQL 配置
1 | mysql> grant process,super,select,replication client on *.* to zabbix_mysql@'localhost' identified by '81f249c2450b3583ae3cc2670f9228'; |
配置zabbix-percona-mysql php
1 | vim /var/lib/zabbix/percona/scripts/ss_get_mysql_stats.php |
设置环境变量1
2ln -sv localphp7php bin/php
ln -sv localmysqlmysql mysql
测试
1 | cd /var/lib/zabbix/percona/scripts |
zabbix-server测试1
2zabbix_get -s 192.168.1.36 -k 'MySQL.Connections';
1045
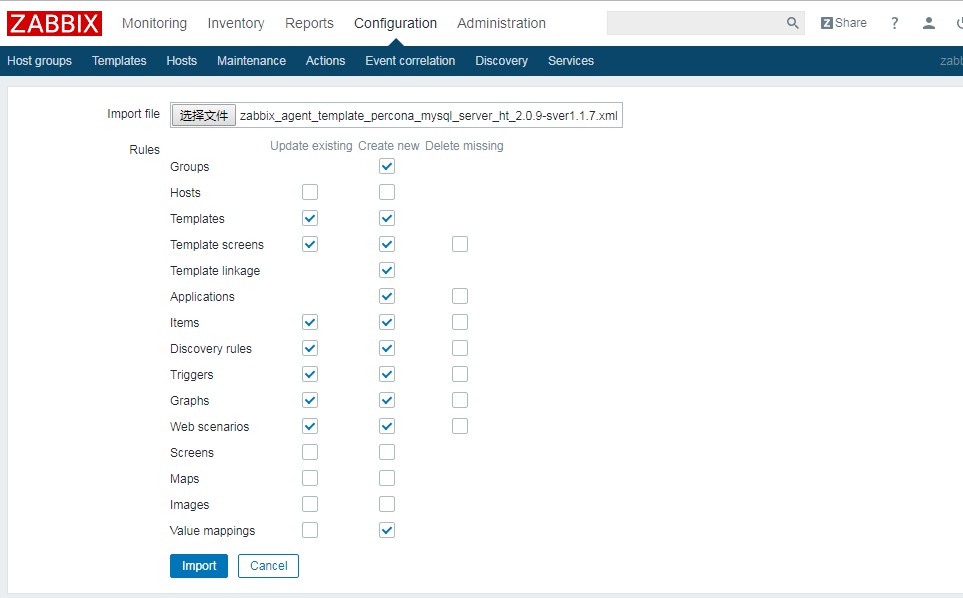
官方zabbix_agent_template_percona_mysql_server_ht_2.0.9-sver1.1.8 导入错误。
使用修改版:
https://github.com/sundayle/linux/blob/master/zabbix/zabbix_agent_template_percona_mysql_server_ht_2.0.9-sver1.1.7.xml
导入模板
Configuration > Templates > import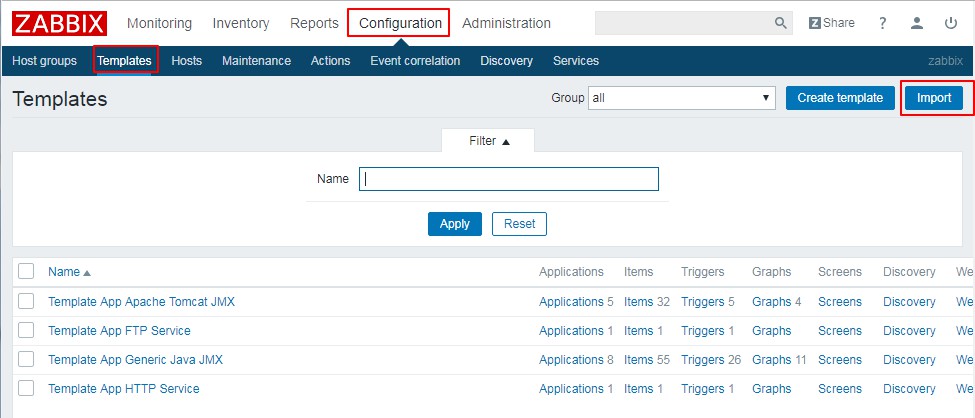
使用模板
Configuration > Hosts > zabbix36 > Templates > Select > Group: Percona Templates >Template Percona MySQL Server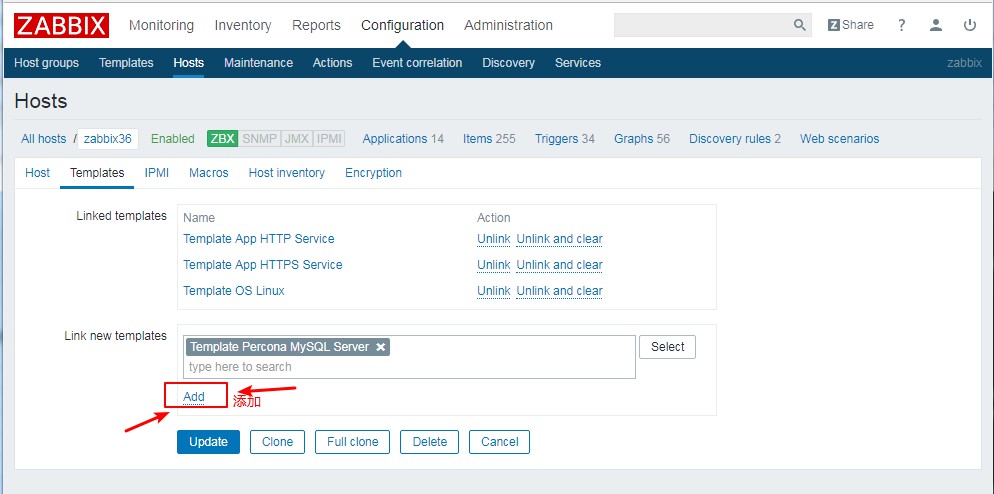
MySQL.running-slave 错误解决
zabbix_get -s 192.168.1.36 -k MySQL.running-slave
ERROR 1045 (28000): Access denied for user ‘zabbix‘@’localhost’ (using password: YES)
01
2
3
4vim /var/lib/zabbix/percona/scripts/vim get_mysql_stats_wrapper.sh
RES=`HOME=~zabbix mysql -e 'SHOW SLAVE STATUS\G' | egrep '(Slave_IO_Running|Slave_SQL_Running):' | awk -F: '{print $2}' | tr '\n' ','`
修改为
RES=`HOME=~zabbix mysql --defaults-extra-file=$DIR/config.cnf -e 'SHOW SLAVE STATUS\G' | egrep '(Slave_IO_Run ning|Slave_SQL_Running):' | awk -F: '{print $2}' | tr '\n' ','`
1 | cat /var/lib/zabbix/percona/scripts/config.cnf |
注: mysql slave stop 是监控Slave_IO_Running|Slave_SQL_Running的,所以正确的操作是:
主库Slave is stopped on {HOST.NAME} Triggers:disable
从库Slave is stopped on {HOST.NAME} Triggers:enable
监控WEB
Configuration > Hosts > zabbix36 > Web > Create web scenario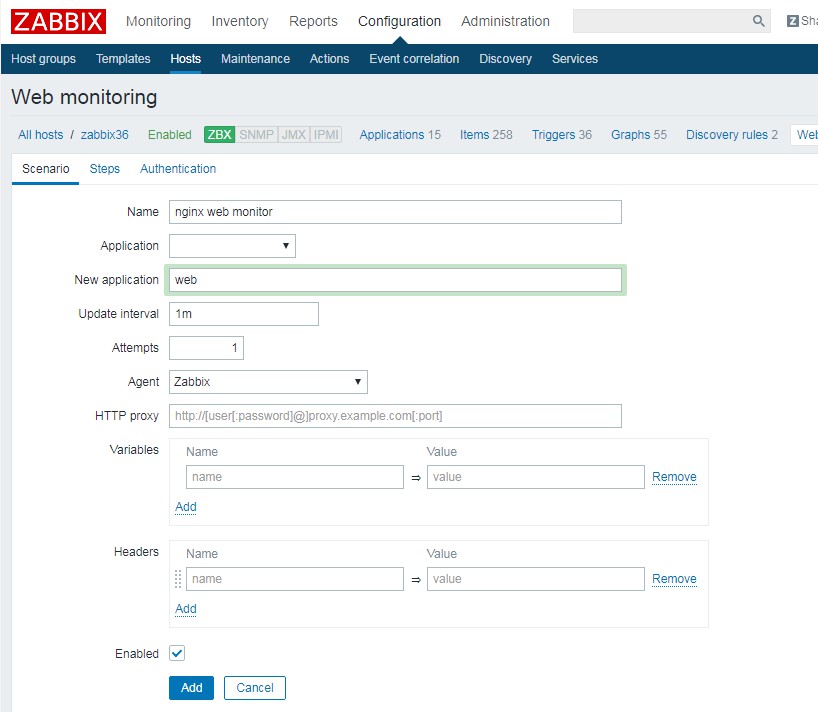
查看效果
Monitoring > Web > nginx web monitor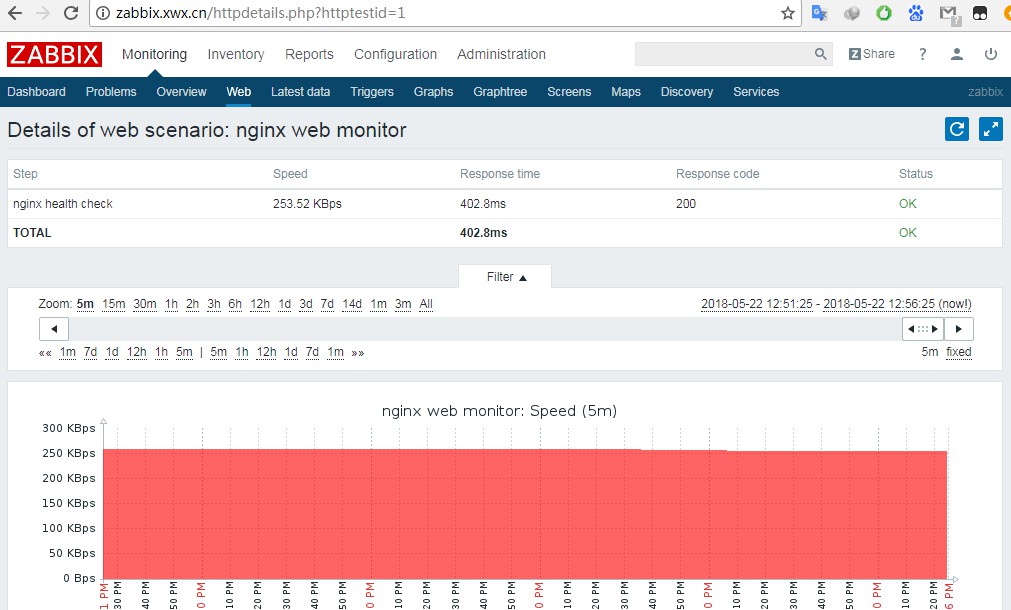
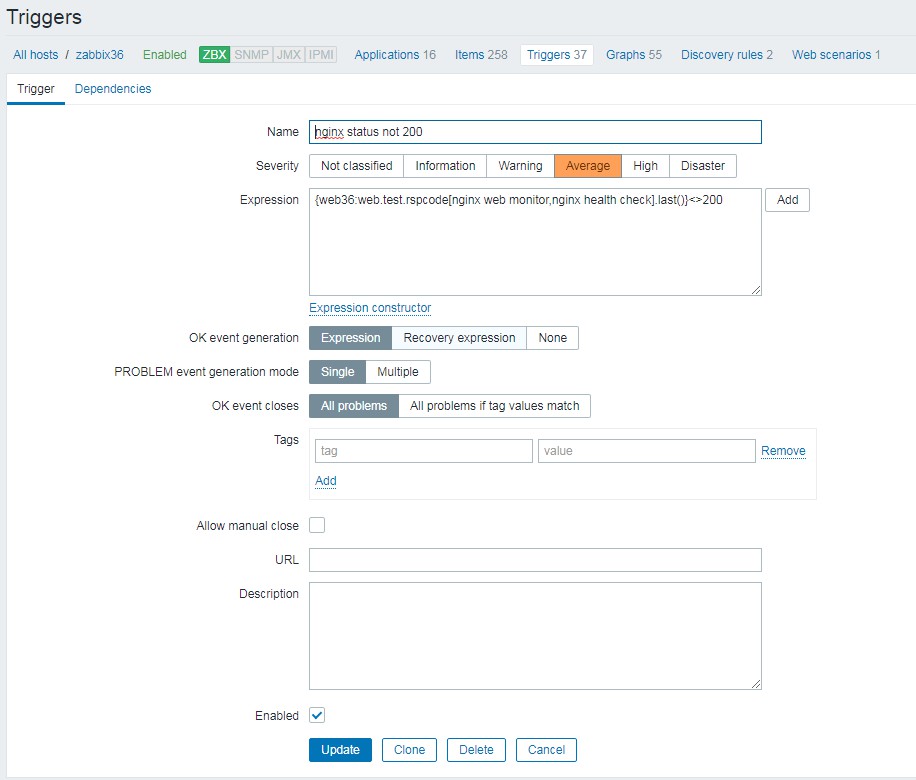
添加触发器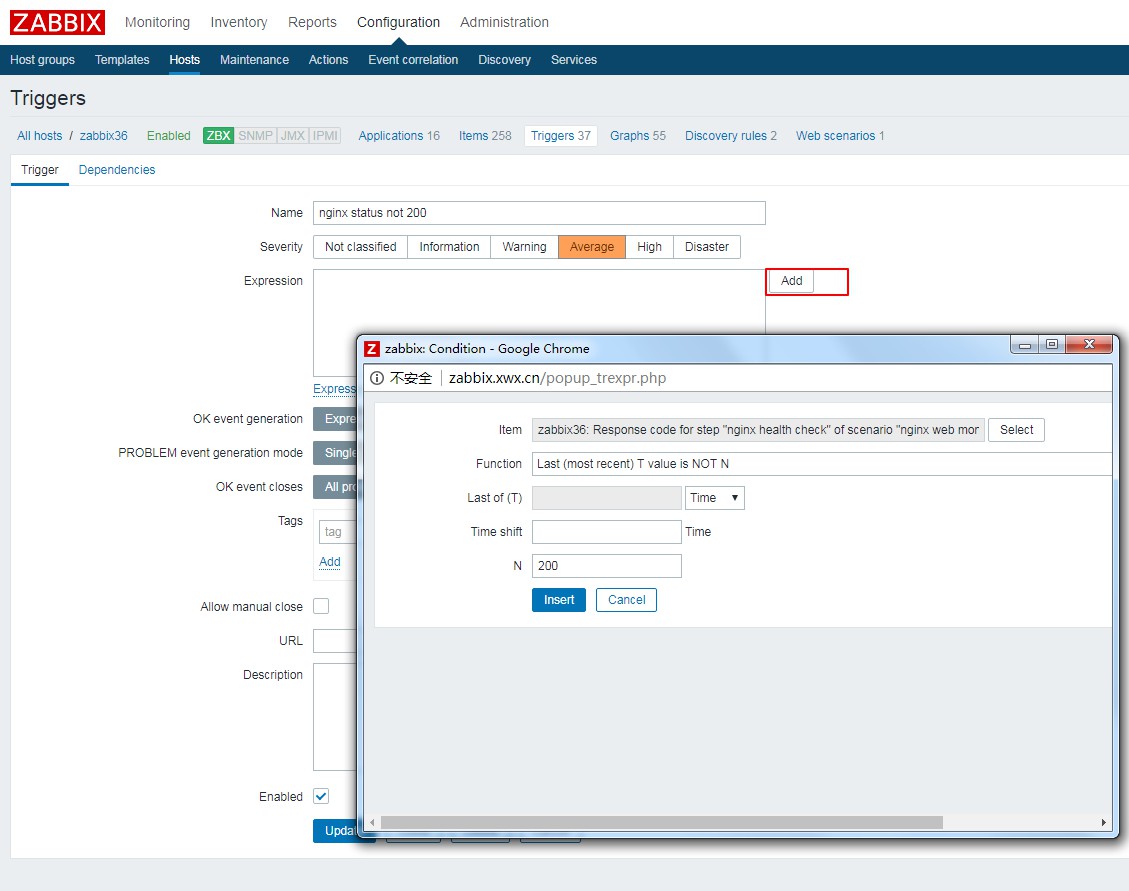
监控Tomcat
监控JMX是通过java gateway来监控Java的。
业务量不大可以安装在zabbix_server服务器上。
zabbix-server: 192.168.1.39
zabbix-java-gateway: 192.168.1.39
tomcat : 192.168.1.37
安装Java-gateway
源码版 编译激活java
./configure –prefix=/usr/local/webserver/zabbix –enable-server –enable-agent –with-mysql –with-net-snmp –with-libcurl –with-libxml2 –enable-proxy
make -j 4 && make install
/usr/local/zabbix/sbin/zabbix_java/startup.sh
/usr/local/zabbix/sbin/zabbix_java/shutdown.sh
yum源版 #yum install -y zabbix-java-gateway java-1.8.0
配置Zabbix-java-gateway
cat /etc/zabbix/zabbix_java_gateway.conf
1 | LISTEN_IP="0.0.0.0" |
/usr/local/webserver/zabbix/sbin/zabbix_java/startup.sh
#yum ## systemctl start zabbix-java-gateway
ss -utnlp | grep 10052
1
tcp LISTEN 0 50 *:10052 *:* users:(("java",pid=64631,fd=12))
Zabbix_server配置
cat /etc/zabbix/zabbix-server.conf
2
3
# JavaGatewayPort=10052
# StartJavaPollers=0
systemctl restart zabbix-server
Tomcat 环境
https://tomcat.apache.org/download-80.cgi
yum install -y java-1.8.0
wget http://mirror.bit.edu.cn/apache/tomcat/tomcat-8/v8.5.31/bin/apache-tomcat-8.5.31.tar.gz
tar xf apache-tomcat-8.5.31.tar.gz.tar.gz
mv apache-tomcat-8.5.31 /usr/local/tomcal
ln -sv /usr/local/apache-tomcat-8.5.31 /usr/local/tomcat
cd /usr/local/tomcat/lib
wget http://archive.apache.org/dist/tomcat/tomcat-8/v8.5.31/bin/extras/catalina-jmx-remote.jar
/usr/local/tomcat/bin/startup.sh
2
3
4
5
6
Using CATALINA_HOME: /usr/local/tomcat
Using CATALINA_TMPDIR: /usr/local/tomcat/temp
Using JRE_HOME: /usr
Using CLASSPATH: /usr/local/tomcat/bin/bootstrap.jar:/usr/local/tomcat/bin/tomcat-juli.jar
Tomcat started.
ss -tunlp | grep -E “8009|8090|8005”
2
3
tcp LISTEN 0 1 ::ffff:127.0.0.1:8005 :::* users:(("java",pid=14462,fd=72))
tcp LISTEN 0 100 :::8009 :::* users:(("java",pid=14462,fd=56))
/usr/local/tomcat/bin/shutdown.sh
关闭tomcat
配置JMX远程监控
官方文档:http://tomcat.apache.org/tomcat-8.0-doc/monitoring.html
JMX三种类型: 1.无密码认证 2.用户面密码认证 3.ssl
这里使用无密码认证
cat /usr/local/tomcat/bin/catalina.sh
2
3
4
5
6
7
8
-Dcom.sun.management.jmxremote
-Djava.rmi.server.hostname=192.168.1.37
-Dcom.sun.management.jmxremote.port=8088
-Dcom.sun.management.jmxremote.ssl=false
-Dcom.sun.management.jmxremote.authenticate=false"
# ----- Execute The Requested Command -----------------------------------------
在Execute The Requested Command前加入如下代码:(添加其他地方会出现乱七八糟的错误)1
2
3
4
5
6CATALINA_OPTS="$CATALINA_OPTS
-Dcom.sun.management.jmxremote
-Djava.rmi.server.hostname=192.168.1.37
-Dcom.sun.management.jmxremote.port=8088
-Dcom.sun.management.jmxremote.ssl=false
-Dcom.sun.management.jmxremote.authenticate=false"
其中的 hostname换成你本机的ip, port 默认为8088。
https://blog.csdn.net/pinyitianle/article/details/51172087
使用cmdline-jmxclient-0.10.3.jar来检测是否可以取到数据
方法一: Linux
java -jar cmdline-jmxclient-0.10.3.jar - 192.168.1.37:8088 java.lang:type=Memory NonHeapMemoryUsage
2
3
4
5
committed: 31916032
init: 2555904
max: -1
used: 30721664
方法二:window
C:\Program Files\Java\jdk1.8.0_171\bin\jconsole.exe

Zabbix-WEB
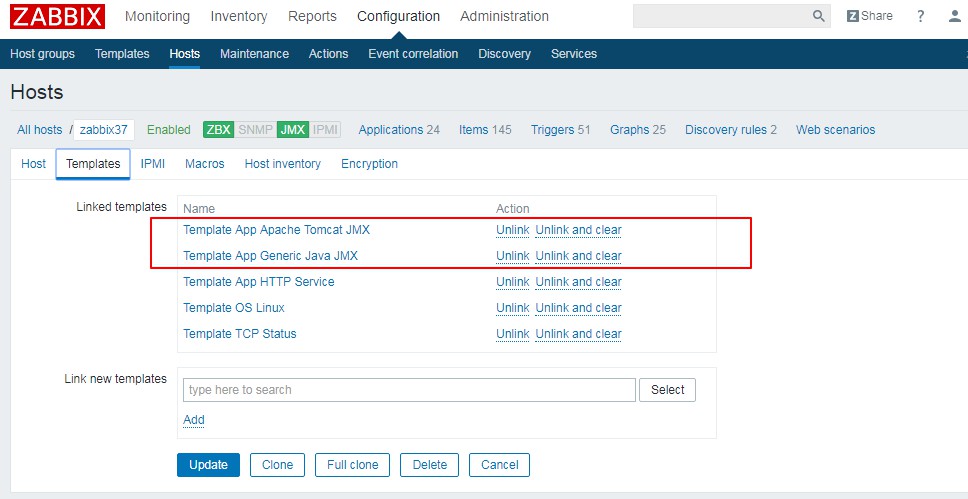
Configuration > Hosts > zabbix37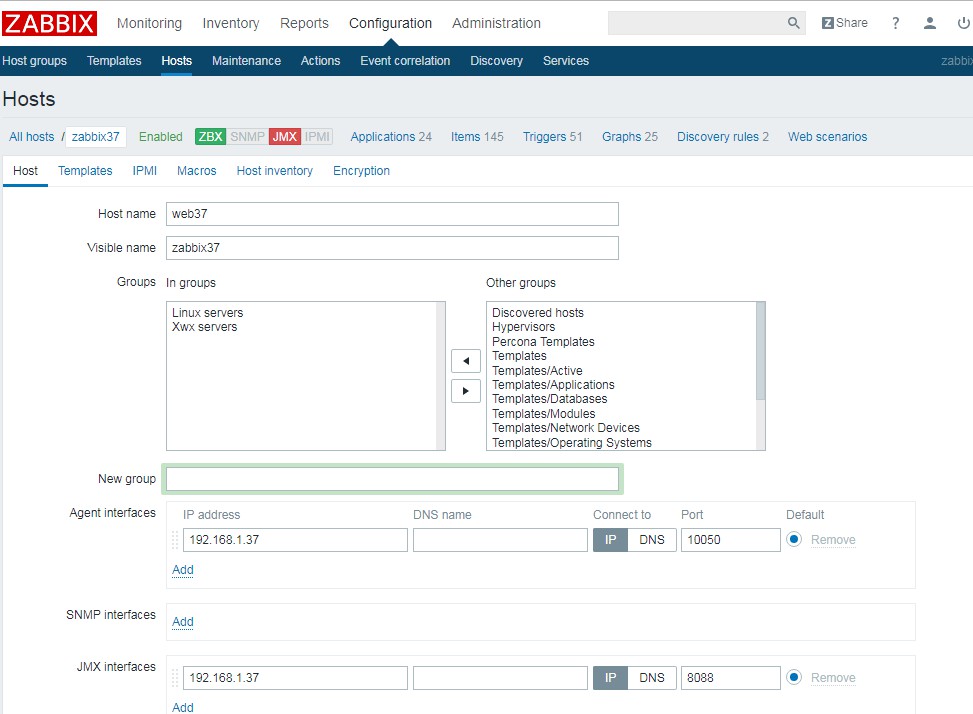
查看效果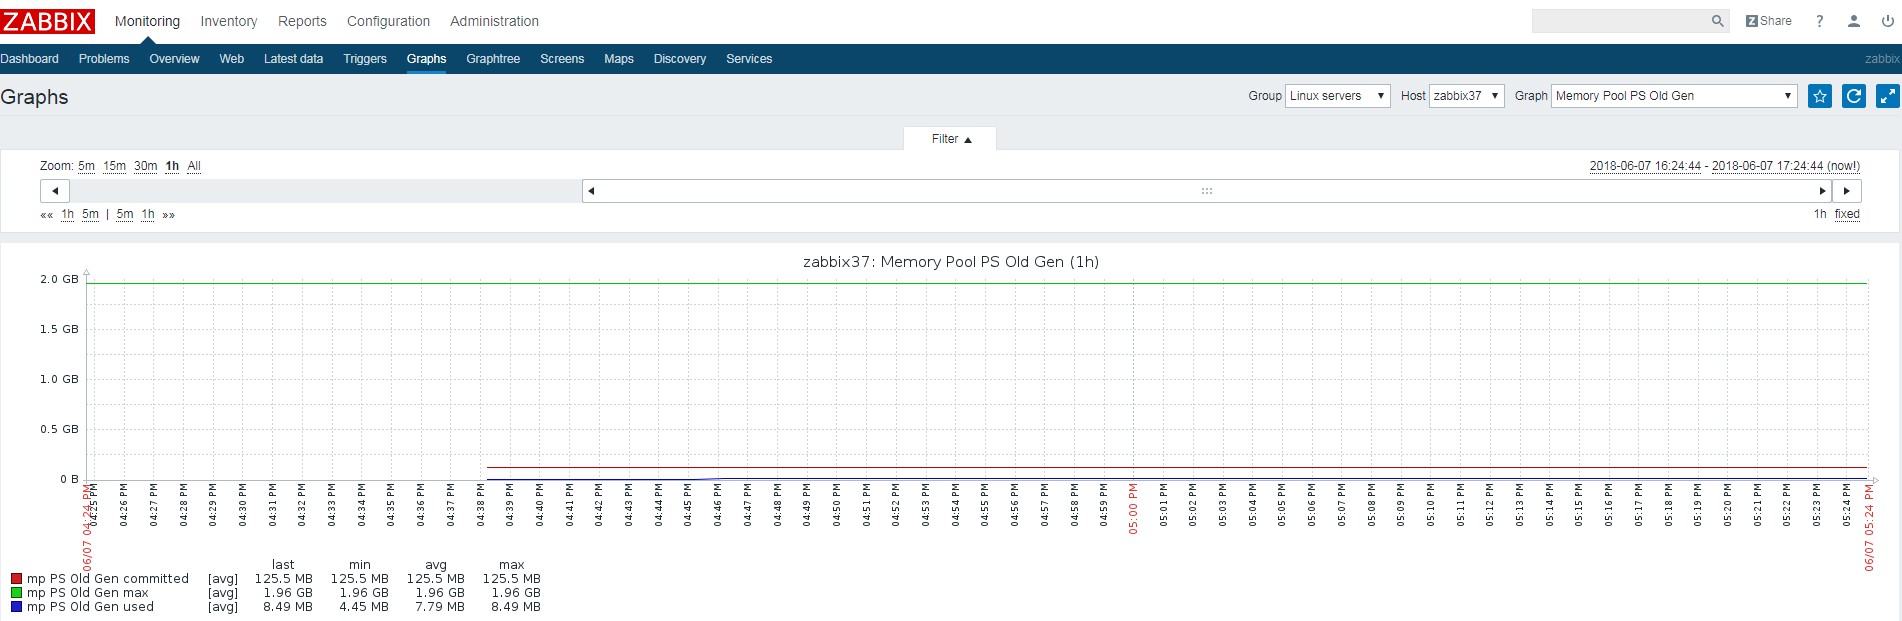
Zabbix Proxy
https://www.zabbix.com/documentation/3.4/manual/distributed_monitoring/proxies
https://www.abcdocker.com/abcdocker/1506
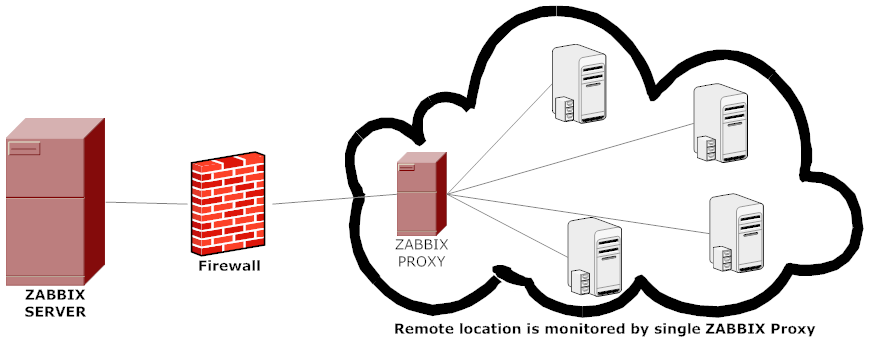
Zabbix代理可以代表Zabbix服务器收集性能和可用性数据。这样,代理可以承担一部分收集数据的负担.
应用场景
常用于多机房情况或者监控主机特别多,几千台左右。这时候使用Zabbix Proxy 可以减轻服务器server的压力,还可以减轻Zabbix的维护。
最常用的特点是适用于多机房、网络不稳定的时候,因为如果直接由Zabbix-server发送信息可能agent没有收到,但是直接使用Zabbix-Proxy就不会遇到这个问题。
环境
zabbix server: 192.168.1.39
zabbix proxy: 192.168.1.38
zabbix agent: 192.168.1.37
zabbix proxy安装
apt-get install -y zabbix-proxy zabbix-proxy-mysql mariadb-server\
##zabbix proxy 数据库
create database zabbix_proxy character set utf8;
grant all on zabbix_proxy.* to zabbix_proxy@localhost identified by ‘zabbix_proxy’;
cd /usr/share/doc/zabbix-proxy-mysql-3.4.9
zcat schema.sql.gz | mysql -uzabbix_proxy -p zabbix_proxy
配置zabbix_proxy.conf
cat /etc/zabbix/zabbix_proxy.conf
2
3
4
5
6
7
8
9
10
11
12
Hostname=Zabbix proxy
DBName=zabbix_proxy #数据库名称
DBUser=zabbix_proxy #用户名
DBPassword=zabbix_proxy #用户密码
#配置文件中没有配置的内容如下:(有需要可以配置)
# ProxyLocalBuffer=0 #数据保留的时间(小时为单位)
# ProxyOfflineBuffer=1 #连不上Server,数据要保留多久(小时为单位,默认1小时)
# DataSenderFrequency=1 #数据的发送时间间隔(默认是1秒)
# StartPollers=5 #启动的线程数
# StartIPMIPollers=0 #启动IPMI的线程数
systemctl start zabbix-proxy
zabbix-web 配置proxies
注:zabbix-proxy没有web的,使用的是zabbix-server-web
Administration > Proxies > Create Proxy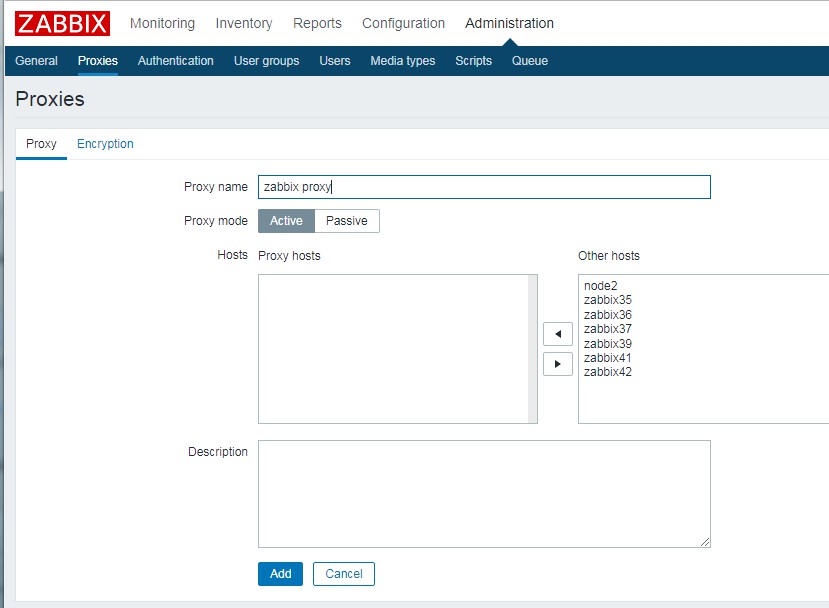
添加zabbix37 客户端 选择代理监控 zabbix proxy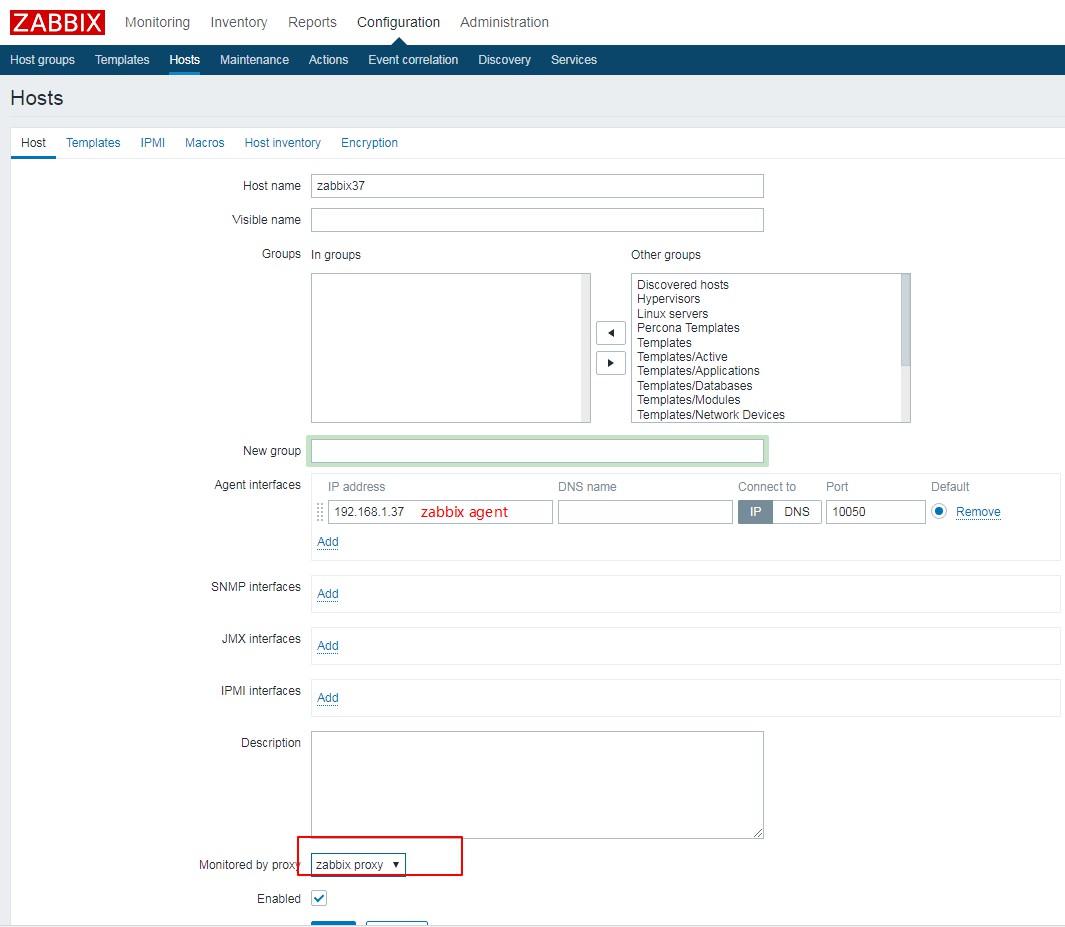
zabbix37 客户端修改配置
cat /etc/zabbix/zabbix_agent.conf
2
#Server=192.168.1.38
https://www.abcdocker.com/abcdocker/1506
主动模式
监控常遇到的问题:
1.监控主机多,性能跟不上,延迟大
2.多机房,防火墙因素
Zabbix可以调整模式提高性能,解决以上问题
Zabbix 模式介绍:
1、被动模式 (默认)
2、主动模式
新建item配置,如使用模板是无法修改成主动模式的,此时我们可以克隆模板自定义修改。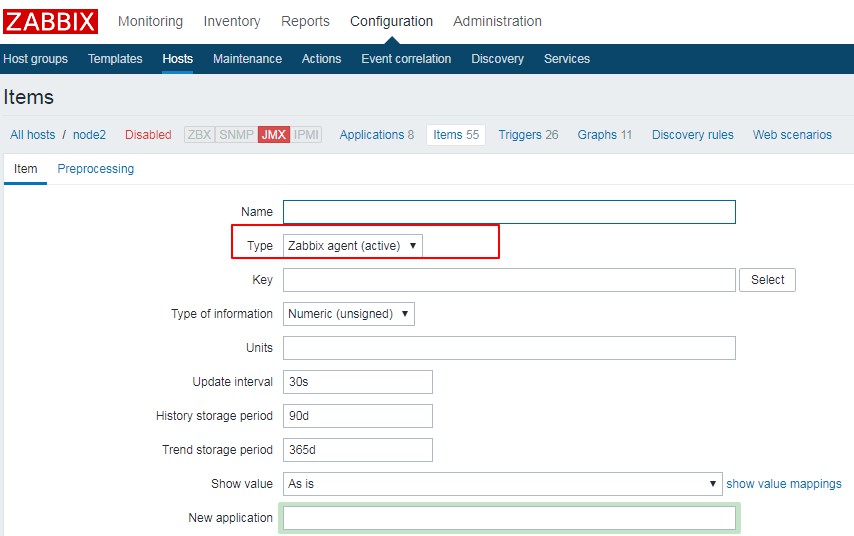
注意:
1、当监控主机超过300+,建议使用主动模式(此处是一个经验值,要根据服务器的硬件来进行考虑)
2、还需要保证Queue对列里面没有延迟的主机
Queue 对列介绍
如果此处的延迟主机有点多的话,我们就需要将被动模式修改为主动模式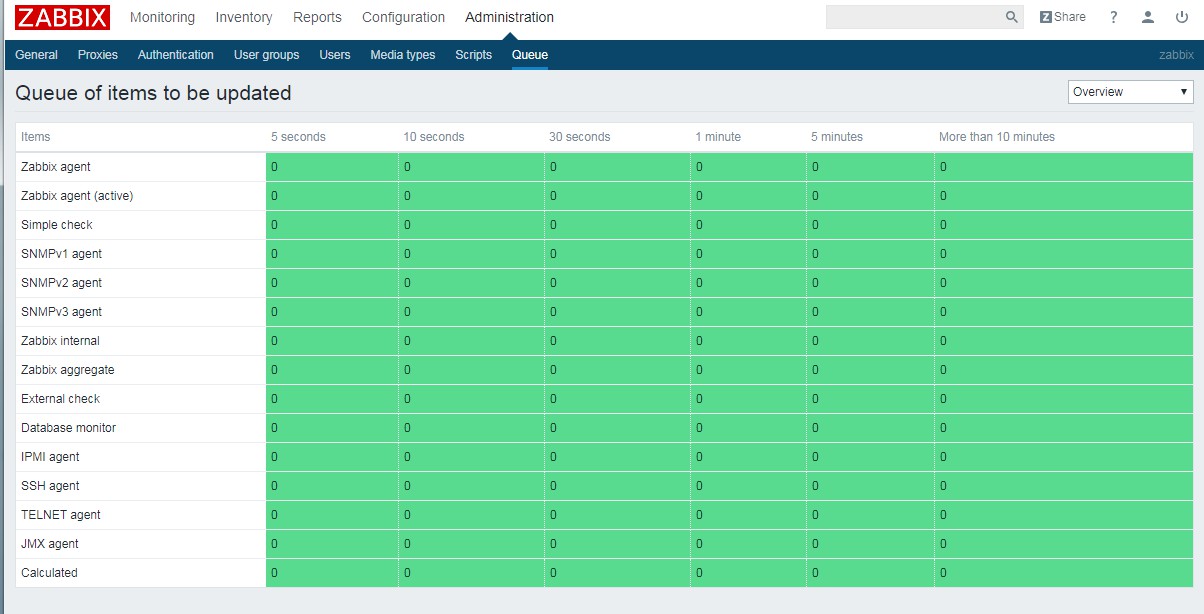
主动模式配置
server: 192.168.1.39
agent: 192.168.1.37
agent操作
cat /etc/zabbix/zabbix_agentd.conf
2
3
4
StartAgents=0 #设置为0之后就不会TCP端口,之前监听TCP端口是因为Server要去问agent信息所以需要开启
ServerActive=192.168.1.39 #zabbix-server IP或域名,他会连接10051端口
Hostname=node1 #唯一识别符
server操作
Configure > Templates > Template OS Linux > Full Clone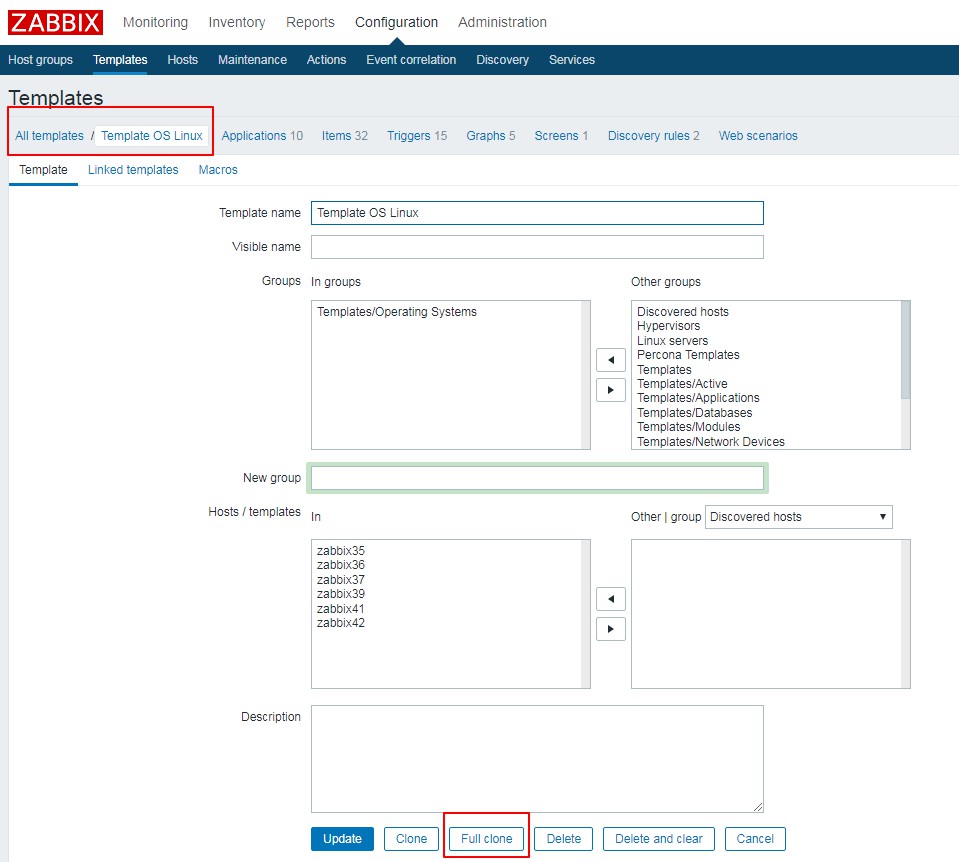
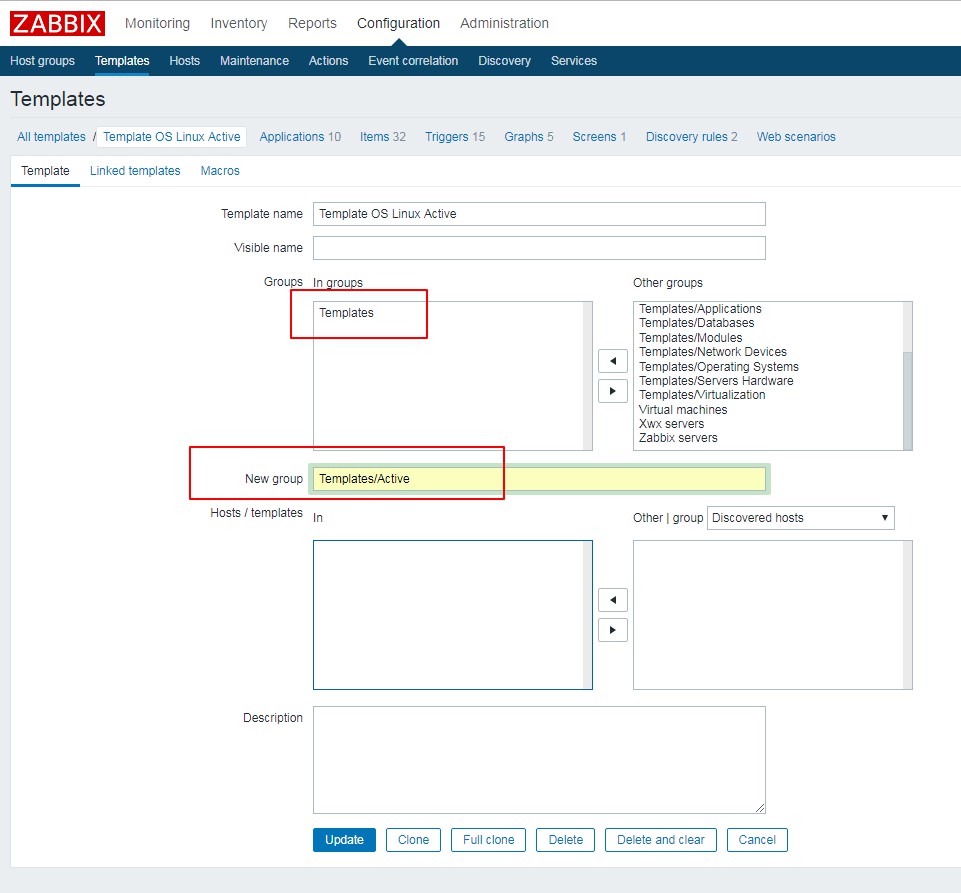
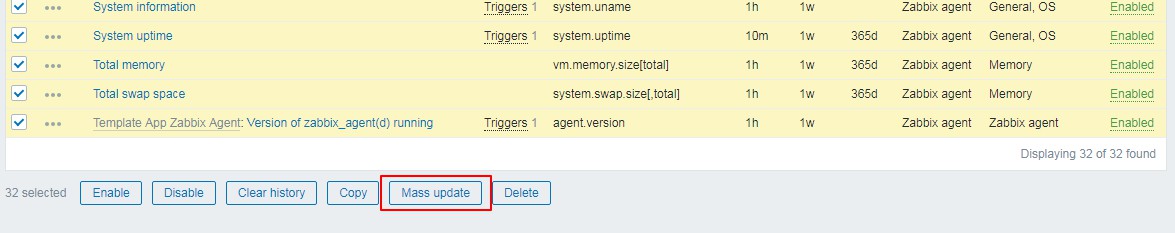
Configure > Templates > Template OS Linux Active > Mass update
批量修改成 Zabbix agent (active)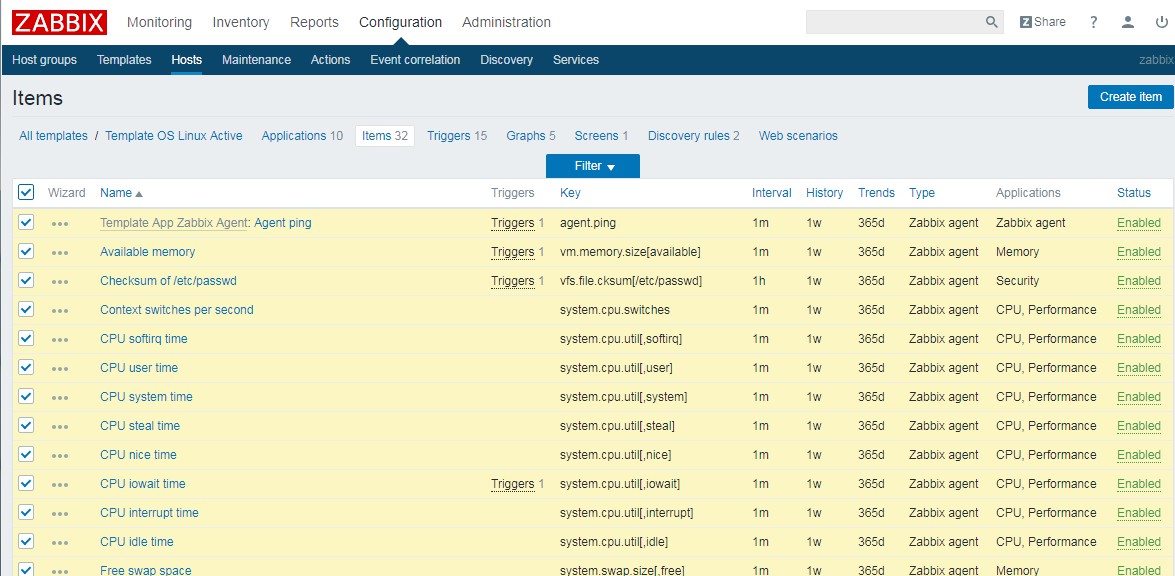

自动化监控
自动化分类
1.自动注册:Zabbix agnet 自动添加
2.主动发现 :自动发现 Discover 、zabbix api
自动注册
Server: 192.168.1.39
Agent: 192.168.1.35
zabbix_agent配置1
2
3
4
5
6
7
8
9
10grep ^[a-Z] /etc/zabbix/zabbix_agentd.conf
PidFile=/var/run/zabbix/zabbix_agentd.pid
LogFile=/var/log/zabbix-agent/zabbix_agentd.log
LogFileSize=0
Server=192.168.1.39
ServerActive=192.168.1.39
Hostname=store35
HostMetadata=system.uname
HostMetadataItem=system.uname
Include=/etc/zabbix/zabbix_agentd.conf.d/*.conf
zabbix web
Configration > Actions > Event source: Auto registration > Create action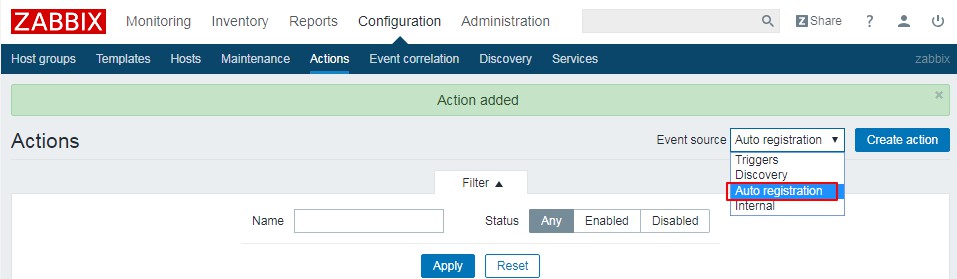
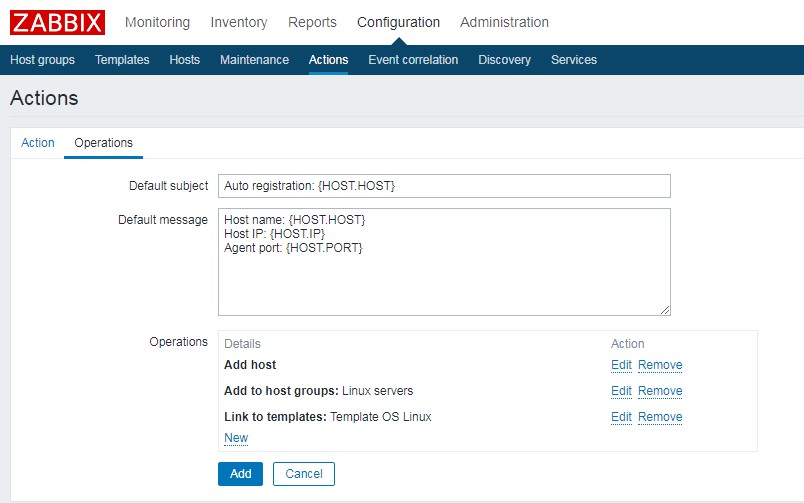
Configuration > Hosts 查看效果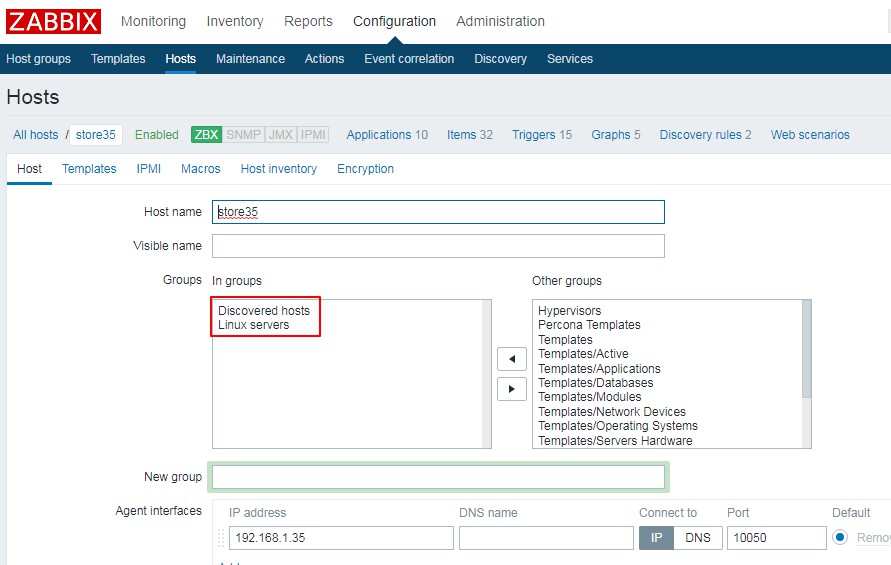
主动发现
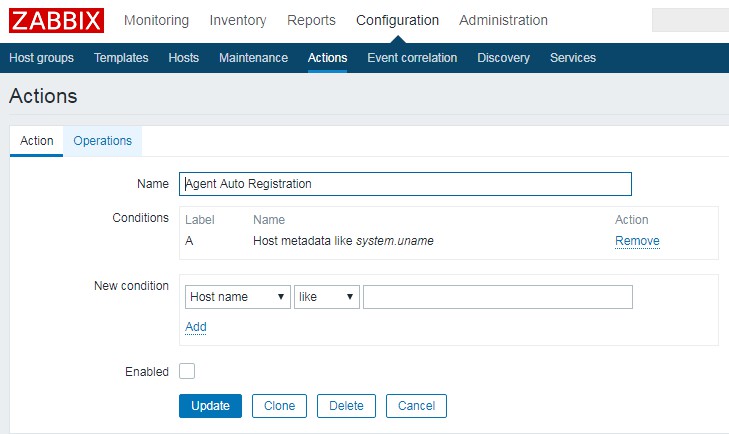
禁用自动注册,因为这会影响自动发现功能
Configuration > Actions > Agent Auto Registration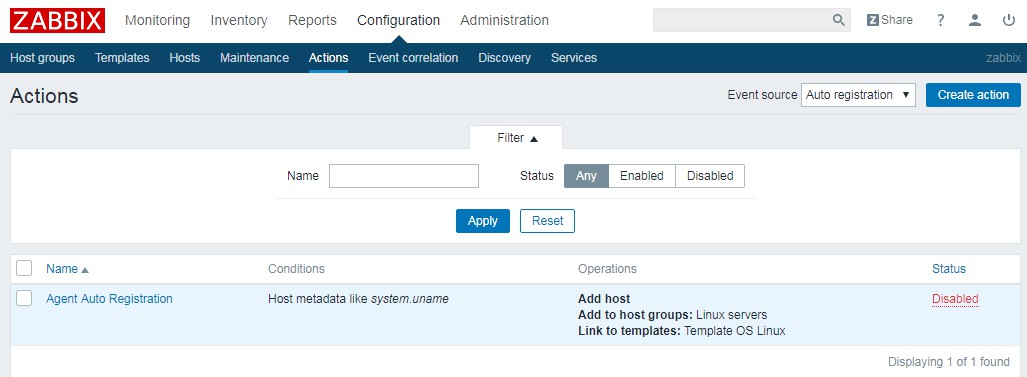
Configuration > Discovery > Create discovery rule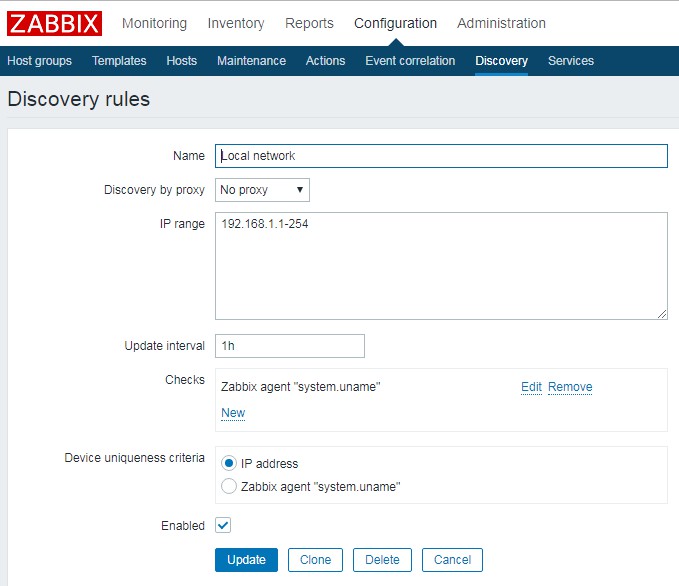
Configuration > Actions > Auto discoyvery.Linux servers > status : Enabled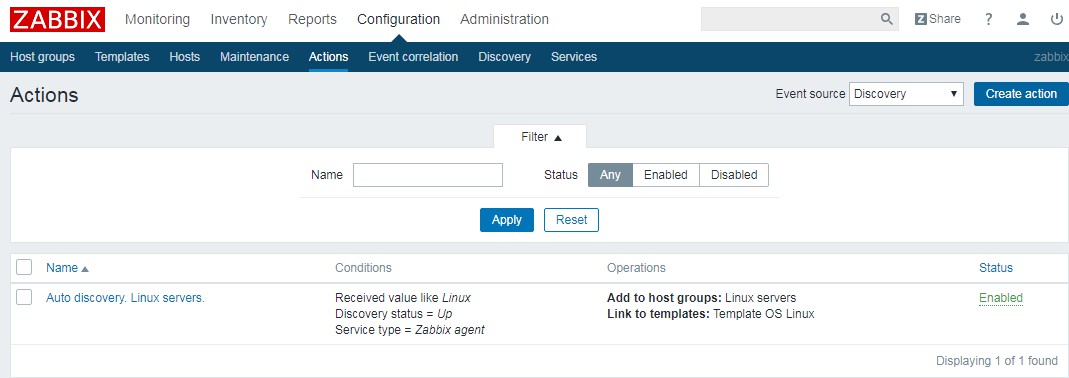
API
官方说明文档:https://www.zabbix.com/documentation/3.4/manual/api1
2
3
4
5
6
7
8
9
10
11
12
13
14
15
16curl -s -X POST -H 'Content-Type:application/json-rpc' -d'
{
"jsonrpc": "2.0",
"method": "user.login",
"params": {
"user": "Admin",
"password": "xxxxx"
},
"id": 1
}' http://zabbix.sundayle.com/api_jsonrpc.php | python -m json.tool
--------返回的结果--------
{
"id": 1,
"jsonrpc": "2.0",
"result": "49bac97c4c27c195d4d7cfabc8811b08"
}
-d 请求的内容
-H 类型
id 名字,类似一个标识
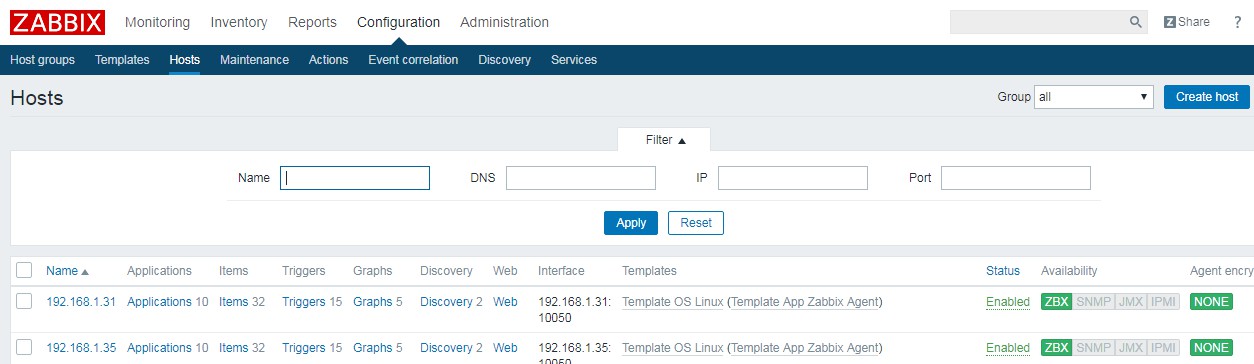
获取所有主机列表
https://www.zabbix.com/documentation/3.4/manual/api/reference/host/get1
2
3
4
5
6
7
8
9
10
11
12
13
14
15
16
17
18
19
20
21
22
23
24
25
26
27
28
29
30
31
32
33
34
35
36
37
38
39
40
41
42
43
44
45curl -s -X POST -H 'Content-Type:application/json-rpc' -d'
> {
> "jsonrpc": "2.0",
> "method": "host.get",
> "params": {
> "output": ["host"]
> },
> "auth": "49bac97c4c27c195d4d7cfabc8811b08",
> "id": 1
> }' http://zabbix.sundayle.com/api_jsonrpc.php | python -m json.tool
--------返回的结果--------
{
"id": 1,
"jsonrpc": "2.0",
"result": [
{
"host": "Zabbix server",
"hostid": "10084"
},
{
"host": "web36",
"hostid": "10256"
},
{
"host": "web41",
"hostid": "10257"
},
{
"host": "store42",
"hostid": "10258"
},
{
"host": "web37",
"hostid": "10259"
},
{
"host": "192.168.1.31",
"hostid": "10276"
},
{
"host": "store35",
"hostid": "10278"
}
]
}
获取所有模板
1 | curl -s -X POST -H 'Content-Type:application/json-rpc' -d' |
获取 Template OS Linux
1 | curl -s -X POST -H 'Content-Type:application/json-rpc' -d' |
快速获取auth 脚本
1 | #!/usr/bin/env python |
1 | apt-get install python-requests |
API 添加 agent
https://www.zabbix.com/documentation/3.4/manual/api/reference/host/create1
2
3
4
5
6
7
8
9
10
11
12
13
14
15
16
17
18
19
20
21
22
23
24
25
26
27
28
29
30
31
32
33
34
35
36
37
38
39
40curl -s -X POST -H 'Content-Type:application/json-rpc' -d'
{
"jsonrpc": "2.0",
"method": "host.create",
"params": {
"host": "zabbix35",
"interfaces": [
{
"type": 1,
"main": 1,
"useip": 1,
"ip": "192.168.1.35",
"dns": "",
"port": "10050"
}
],
"groups": [
{
"groupid": "2"
}
],
"templates": [
{
"templateid": "10001"
}
]
},
"auth": "7dc4c5082132c74c70624a60403a6b76",
"id": 1
}' http://zabbix.sundayle.com/api_jsonrpc.php | python -m json.tool
--------返回的结果--------
{
"id": 1,
"jsonrpc": "2.0",
"result": {
"hostids": [
"10280"
]
}
}
groupid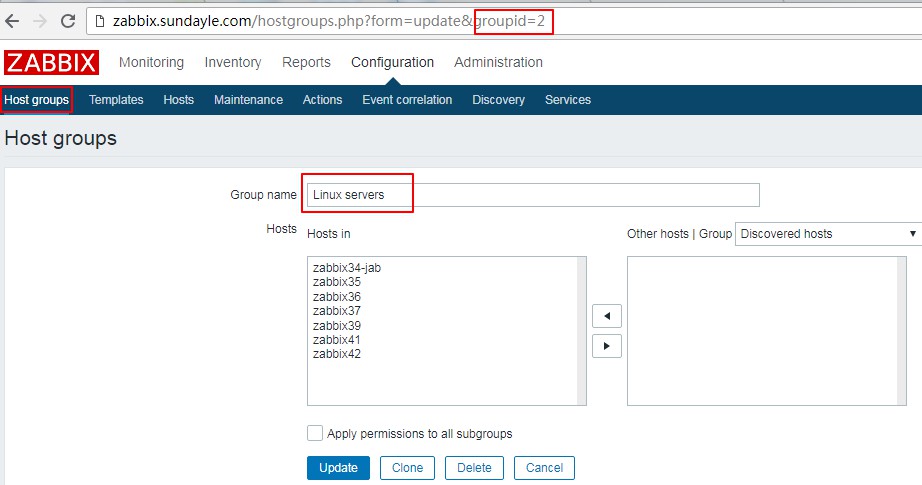
templateid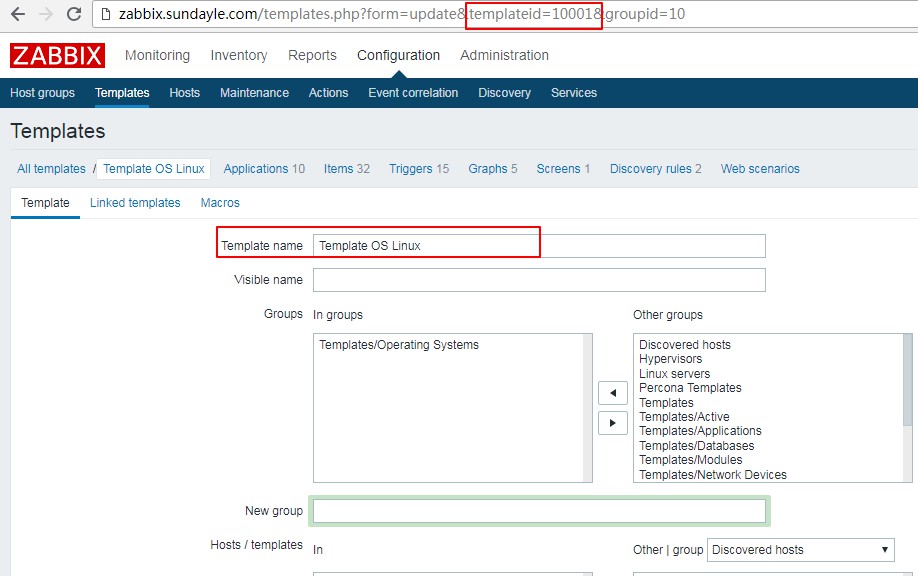
https://www.abcdocker.com/abcdocker/1510